5 Quantitative Analysis
72 GCMS-QP2010 Series Operation Guide
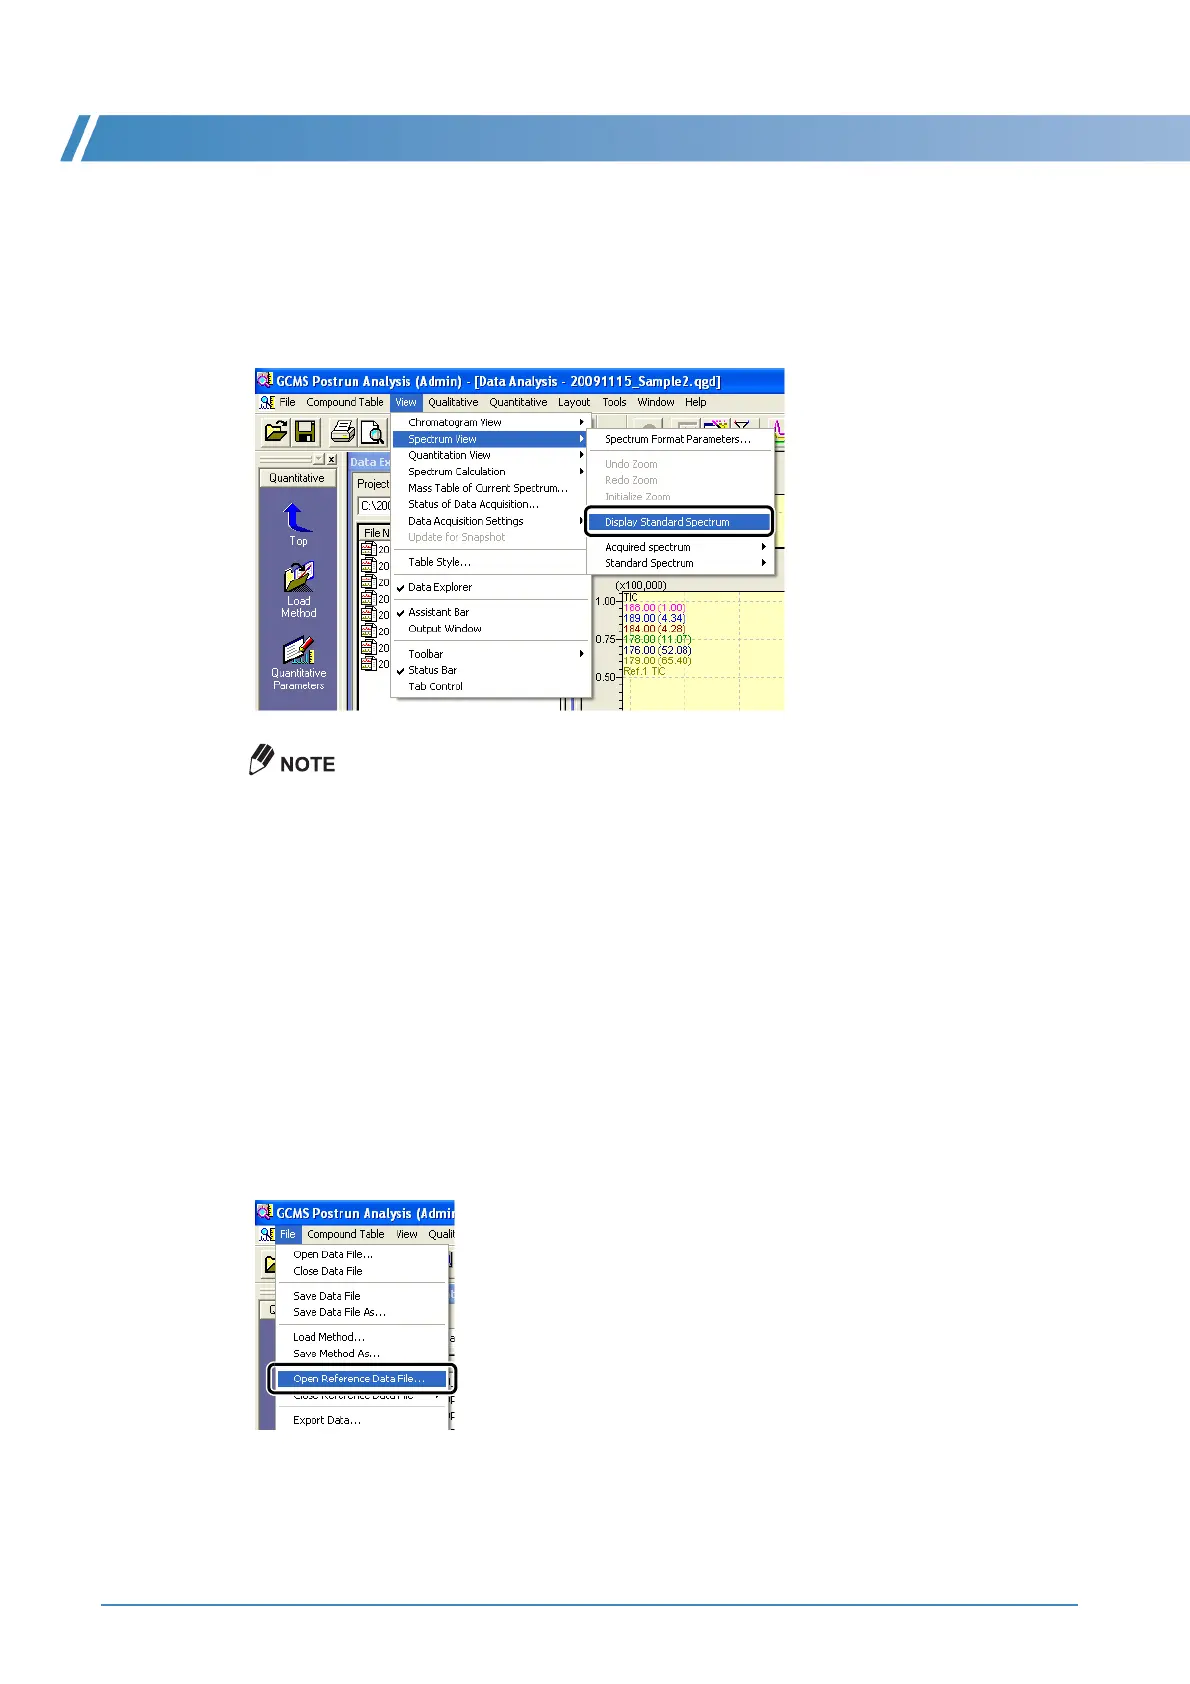
Displaying Standard Spectra
Data can be analyzed more easily by comparing the displayed spectrum with a standard spectrum.
1
Click [Spectrum View] on the [View] menu, then select [Display Standard Spectrum].
The standard spectrum is displayed.
The standard spectrum is a mass spectrum of a standard sample registered when the compound
table was created.
The standard spectrum can be hidden by repeating step 1 above.
When the measured spectrum is enlarged by dragging, the standard spectrum is enlarged
correspondingly.
Displaying Reference Data
Compounds can be identified from the shape of chromatograms, retention times, and other information
obtained by referencing measurement data of standard samples or spiked samples.
1
Select [Open Reference Data File] on the [File] menu to open the data file being
referenced.
The reference data is displayed.

 Loading...