GCMS-QP2010 Series Operation Guide 71
5.3 Analyzing Data
5
^ Reference
If necessary, perform identification or peak integration with reference to "Manual Identification and
Manual Peak Integration" P.63.
The same process can be accomplished more easily by performing the following operations on the
chromatogram.
6
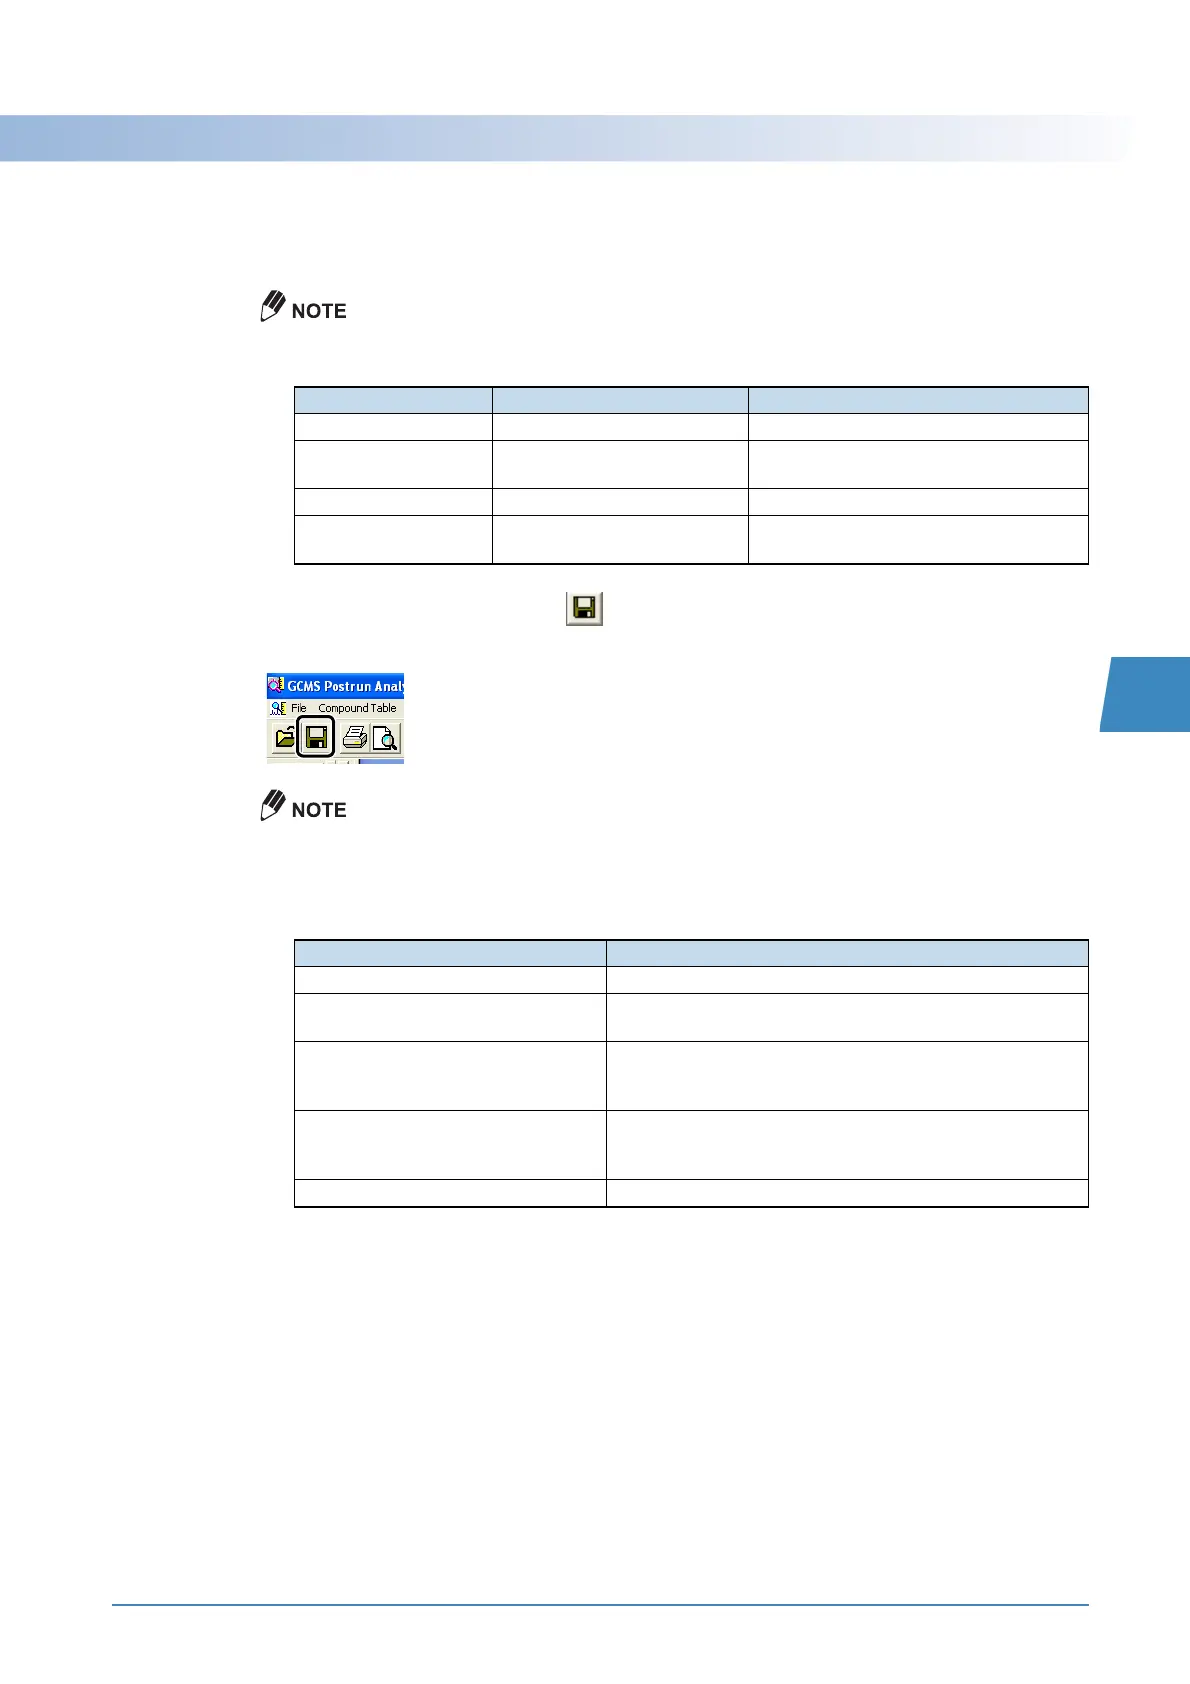
After checking the results, click (Save) on the toolbar.
The data file is saved.
When peaks are integrated for quantitation, concentrations calculated from the calibration curve are
displayed.
However, if quantitation fails, character strings other than concentration values are displayed
according to the cause of failure, as described below.
Process Operation Explanation
Manual Identification [Shift] + [Ctrl] + right-click Identifies integrated peaks.
Manual Peak Integration [Shift] + right-click-drag Connects start point and end point as
baseline.
Manual Peak Integration [Ctrl] + right-click-drag Connects points with horizontal baseline.
Delete Identification
Results
[Shift] + [Ctrl] + right-double-click Voids identification and removes
quantitative calculation results.
Displayed Character String Explanation
No peak is detected. Quantitative peak integration resulted in no peaks detected.
No peak is found in Window/Band
range.
No peaks were detected within the retention time range
specified for identification.
Ratio of reference ion does not match. Peak is not identified due to the difference between specified
and measured reference ion ratio values exceeding the
allowable range.
Under the minimum similarity index. Peak is not identified due to the measured similarity being less
than the specified similarity setting, when mass pattern
matching is specified in identification parameters.
No peak is identified. Automatic identification results were manually deleted.

 Loading...