5 Quantitative Analysis
70 GCMS-QP2010 Series Operation Guide
4
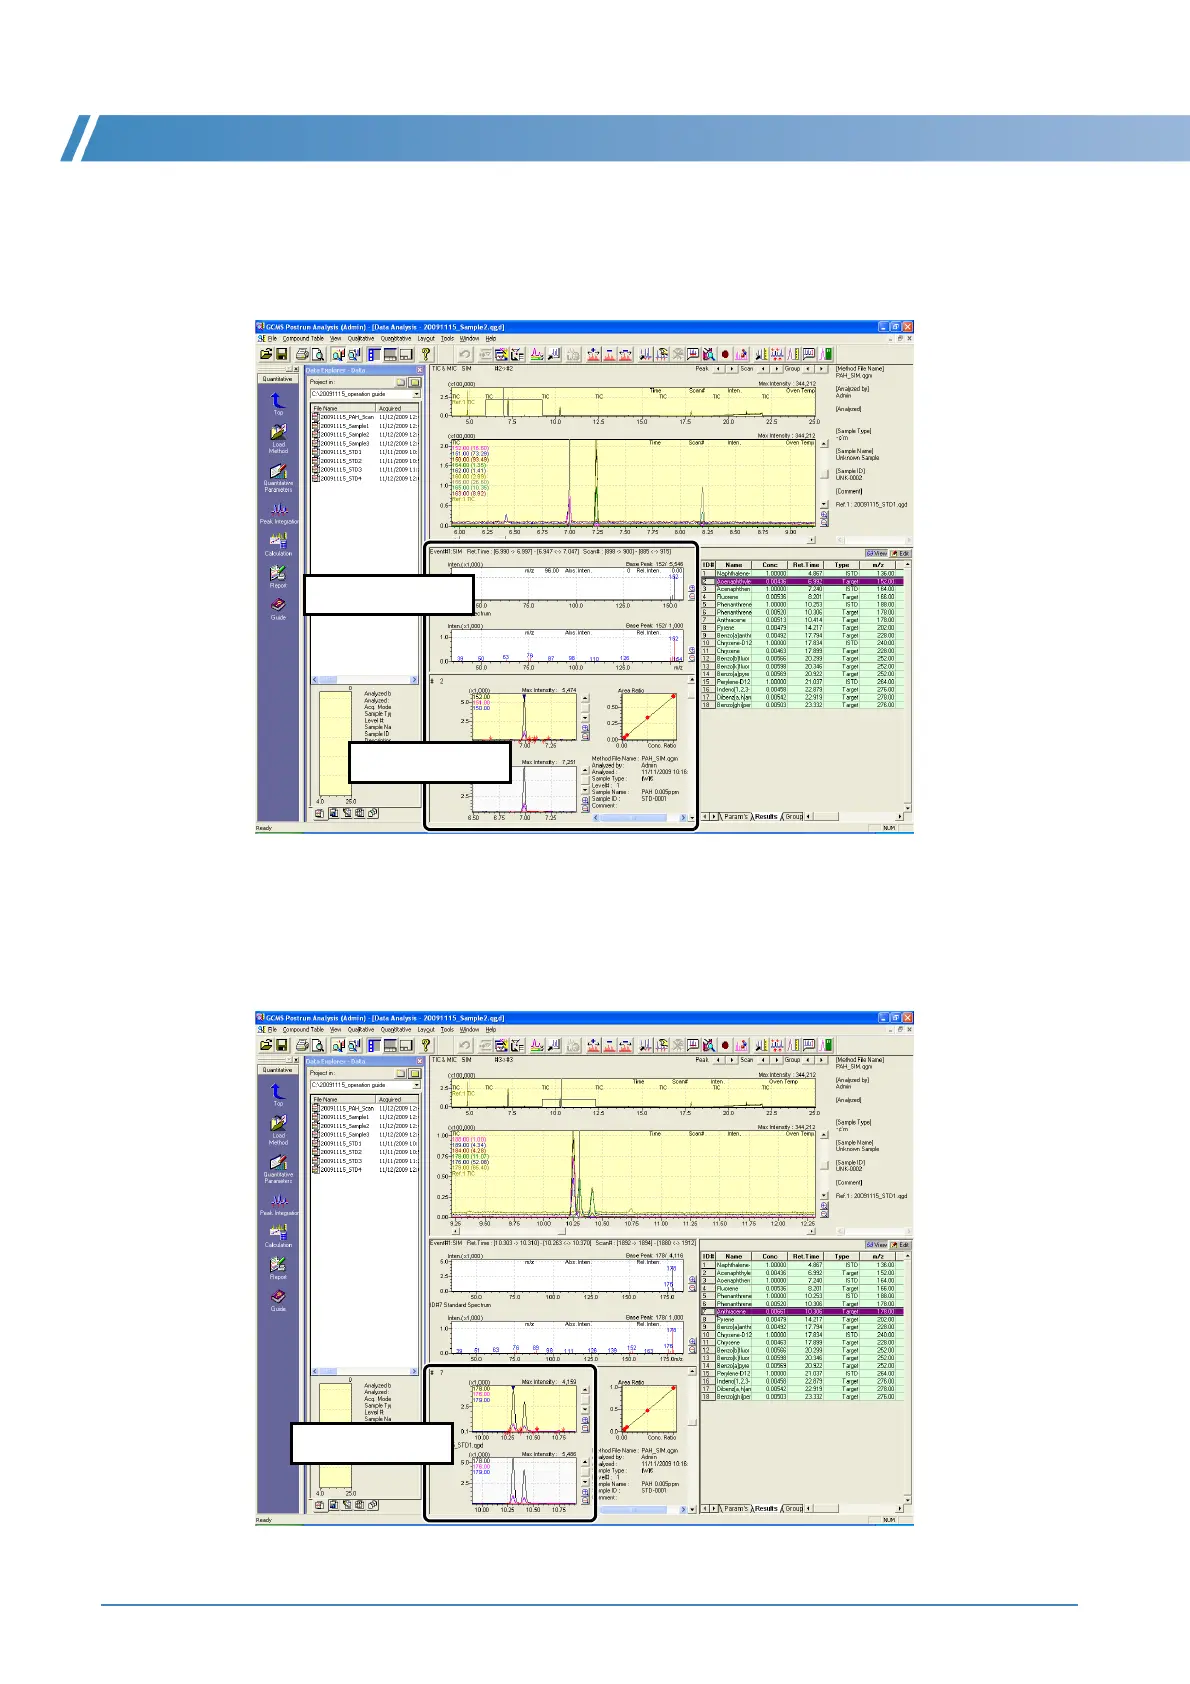
Display the standard spectra sub-window and reference data sub-window in the
[Quantitative View] area.
If necessary, see "Displaying Standard Spectra" P.72 ,"Displaying Reference Data" P.72 to display
information about identified compounds.
5
Click on a compound name in the compound table and check the chromatogram in the
[Quantitative View].
Check the results while viewing the peak identification/detection marks and baseline in the
chromatogram.
Reference Data
Standard Spectrum
Qantitative View

 Loading...