II-23
Fig. 2-29-1 The procedure for displaying the FISH LENGTH GRAPH
Fig.2-29-2 Figure of number decrease by the graph reduction
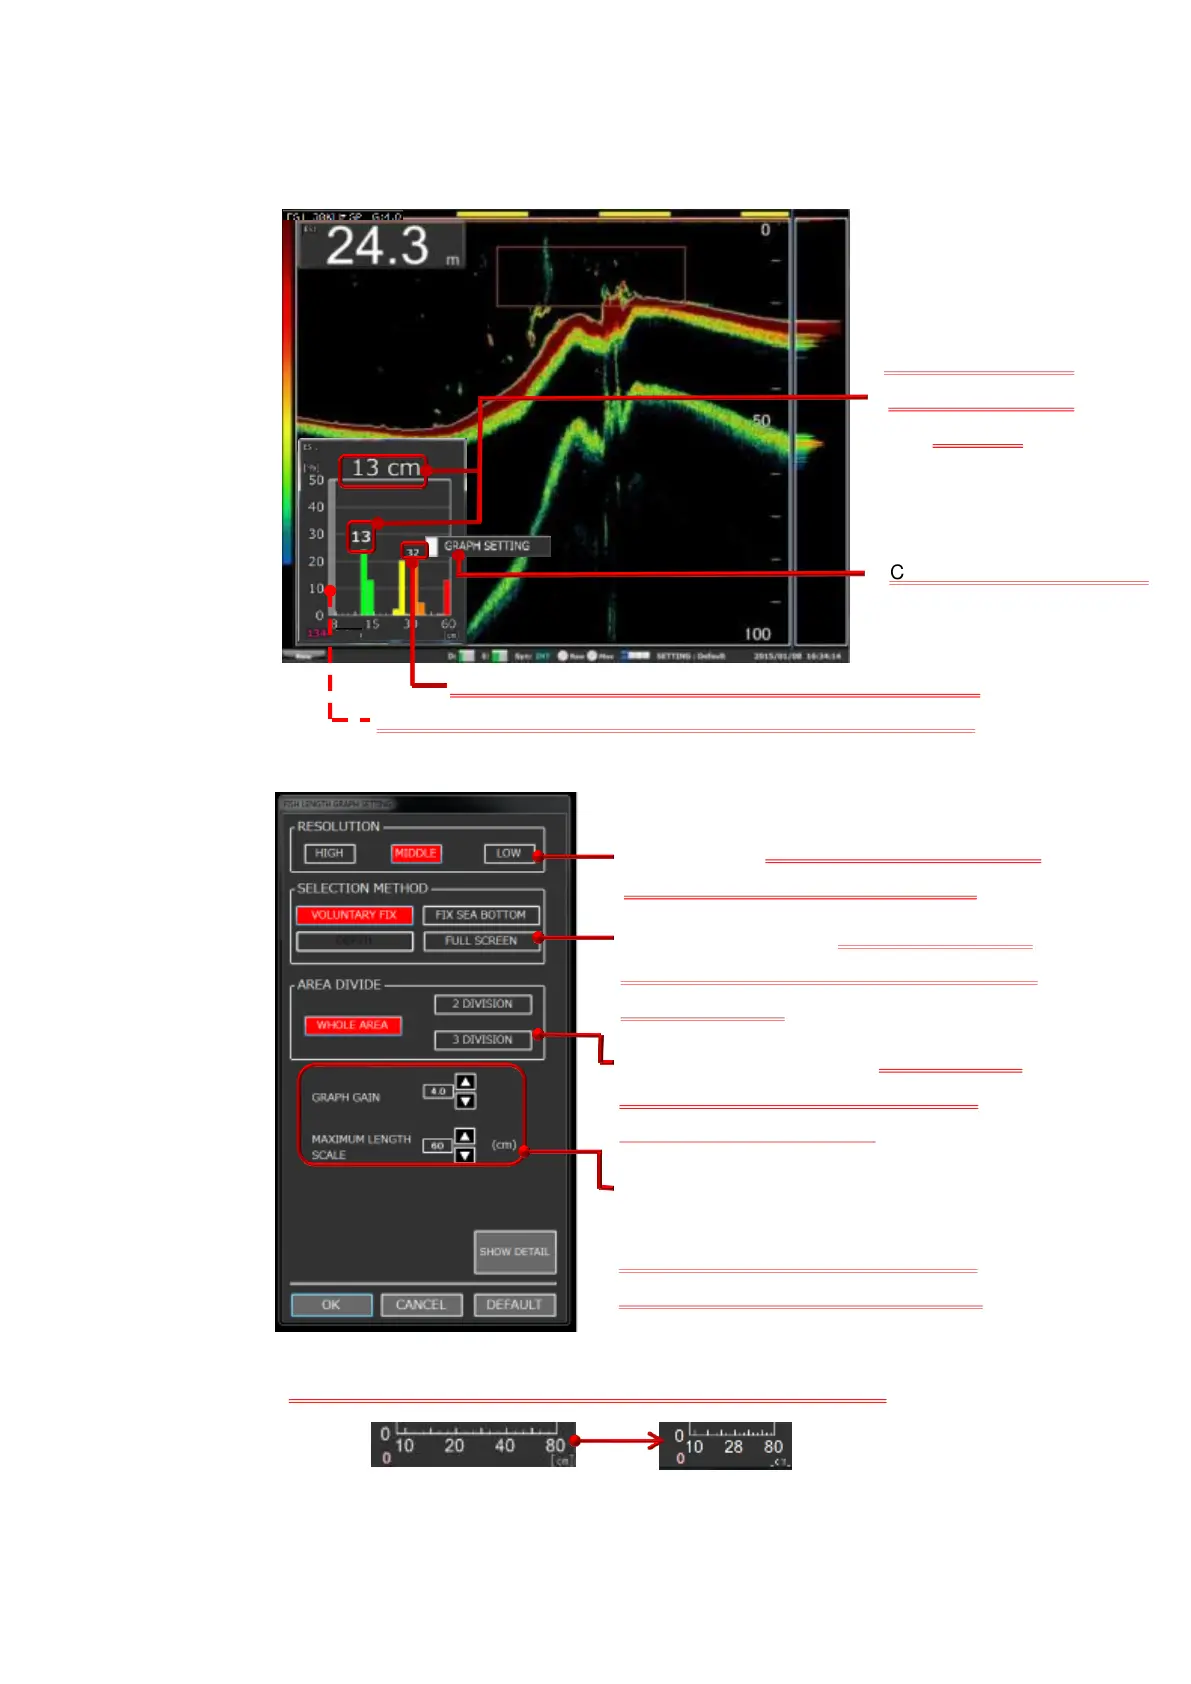
Display the fish length graph in the ES display area (the figure below shows
that VOLUNTARY FIX is selected.)
The fish length of the
highest frequency is
The fish length of the second highest frequency is displayed.
A response of a single fish outside of the graph setting is displayed.
Press the GRAPH SETTING button to display the FISH LENGTH GRAPH
SETTING window.
RESOLUTION: A function to automatically set
the resolution level of the graph display.
SELECTING METHOD: For selecting the fish
length detection ranges. (Details are described
in Section 2-10-1.)
DETECTION RANGE SPLIT: For splitting the
fish length detection range. (Details are
described in Section 2-10-3.)
GRAPH GAIN, MAXIMUM LENGTH SCALE,
DETAIL DISPLAY:
For setting the FISH LENGTH GRAPH.
(Details are described in Section 2-10-2.)
A response of a single fish outside of the graph setting is displayed.