II-46
2-12-2 How to use Biomass display
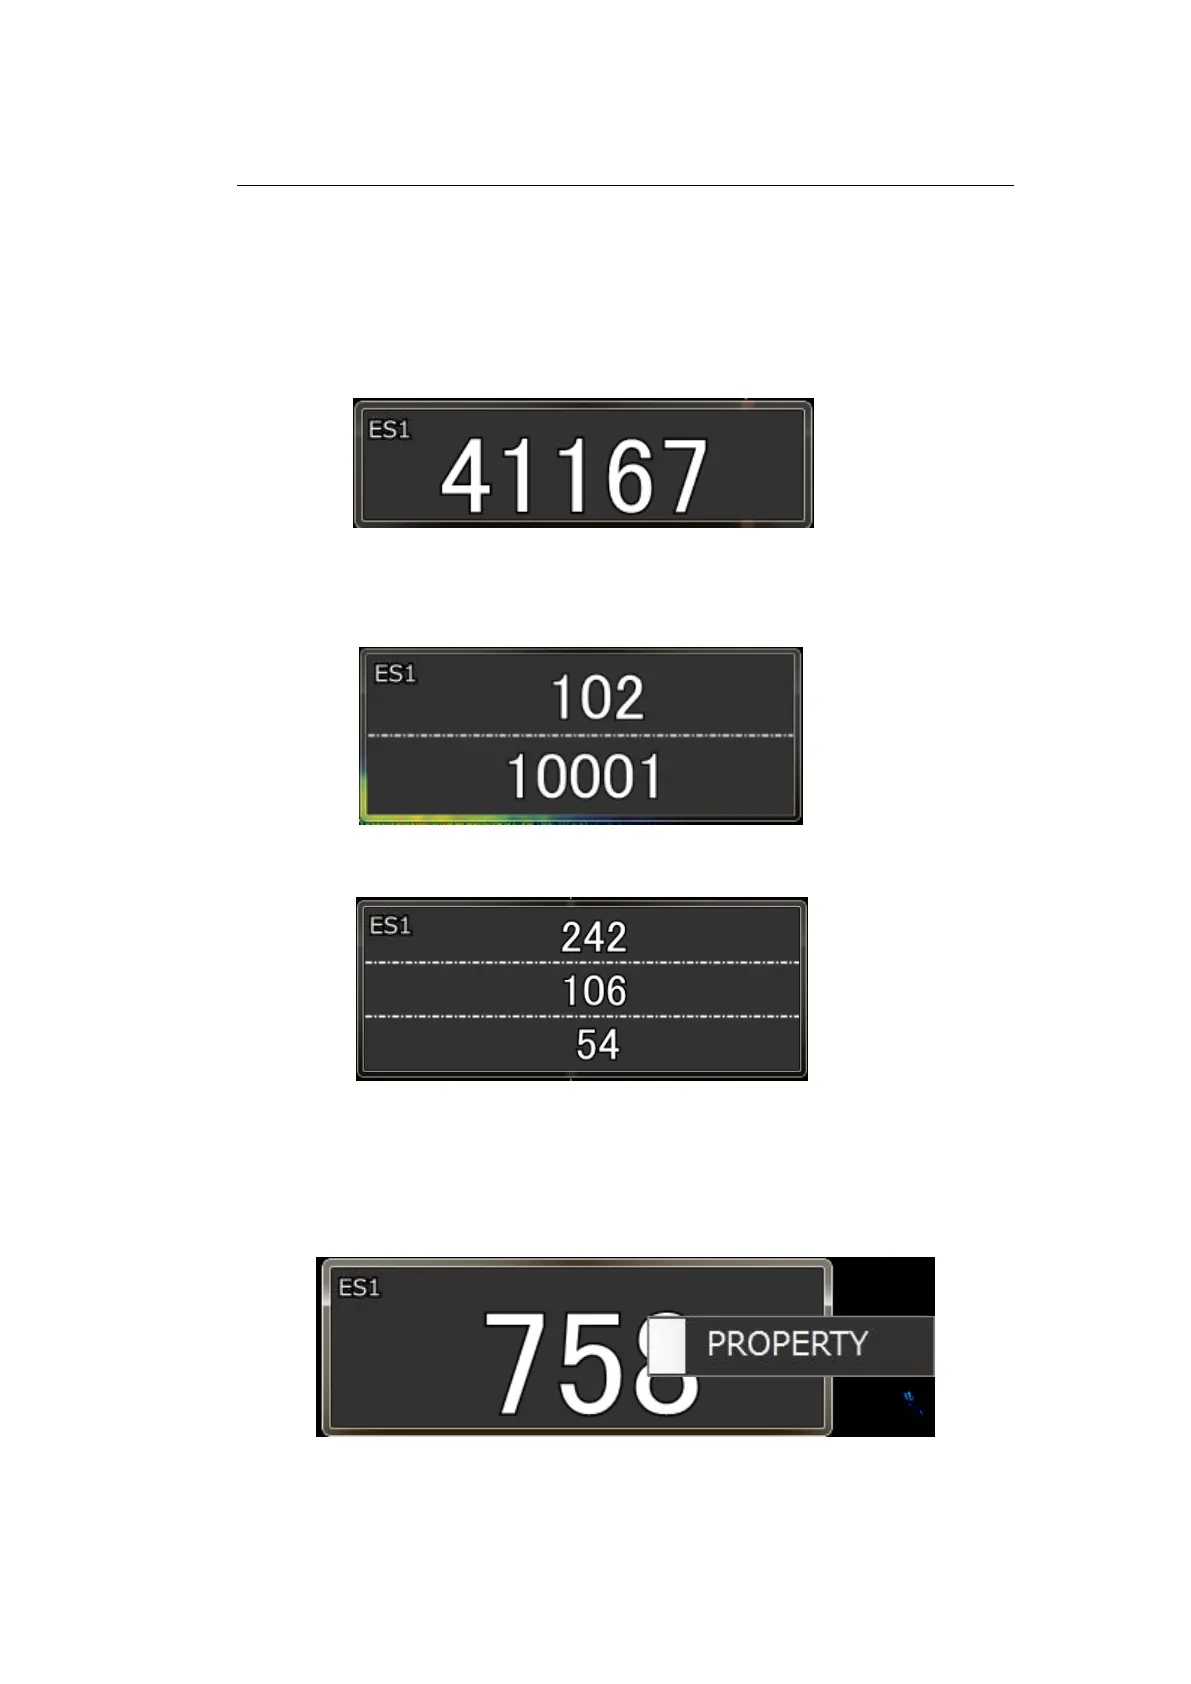
When the detection range is divided into two or three in the fish length graph
setting screen or in the TS graph setting screen, the displayed calculation results
of the detection ranges are separated by a dashed line(s) as shown in the figure
below:
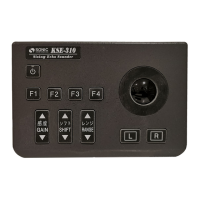
Fig. 2-51 Biomass display when the detection range is not divided
Fig. 2-52 Biomass display when the detection range is divided into two
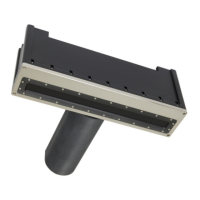
Fig. 2-53 Biomass display when the detection range is divided into three
Press the R-key on the biomass display screen to display the property checkbox.
Press the L-key here to display the BIOMASS SETTINGS screen.
Fig. 2-54 Property window to display the BIOMASS SETTINGS screen