II-38
2-10-4 TS GRAPH setting
Like the FISH LENGTH GRAPH, the TS GRAPH setting can change the
settings of the TS GRAPH.
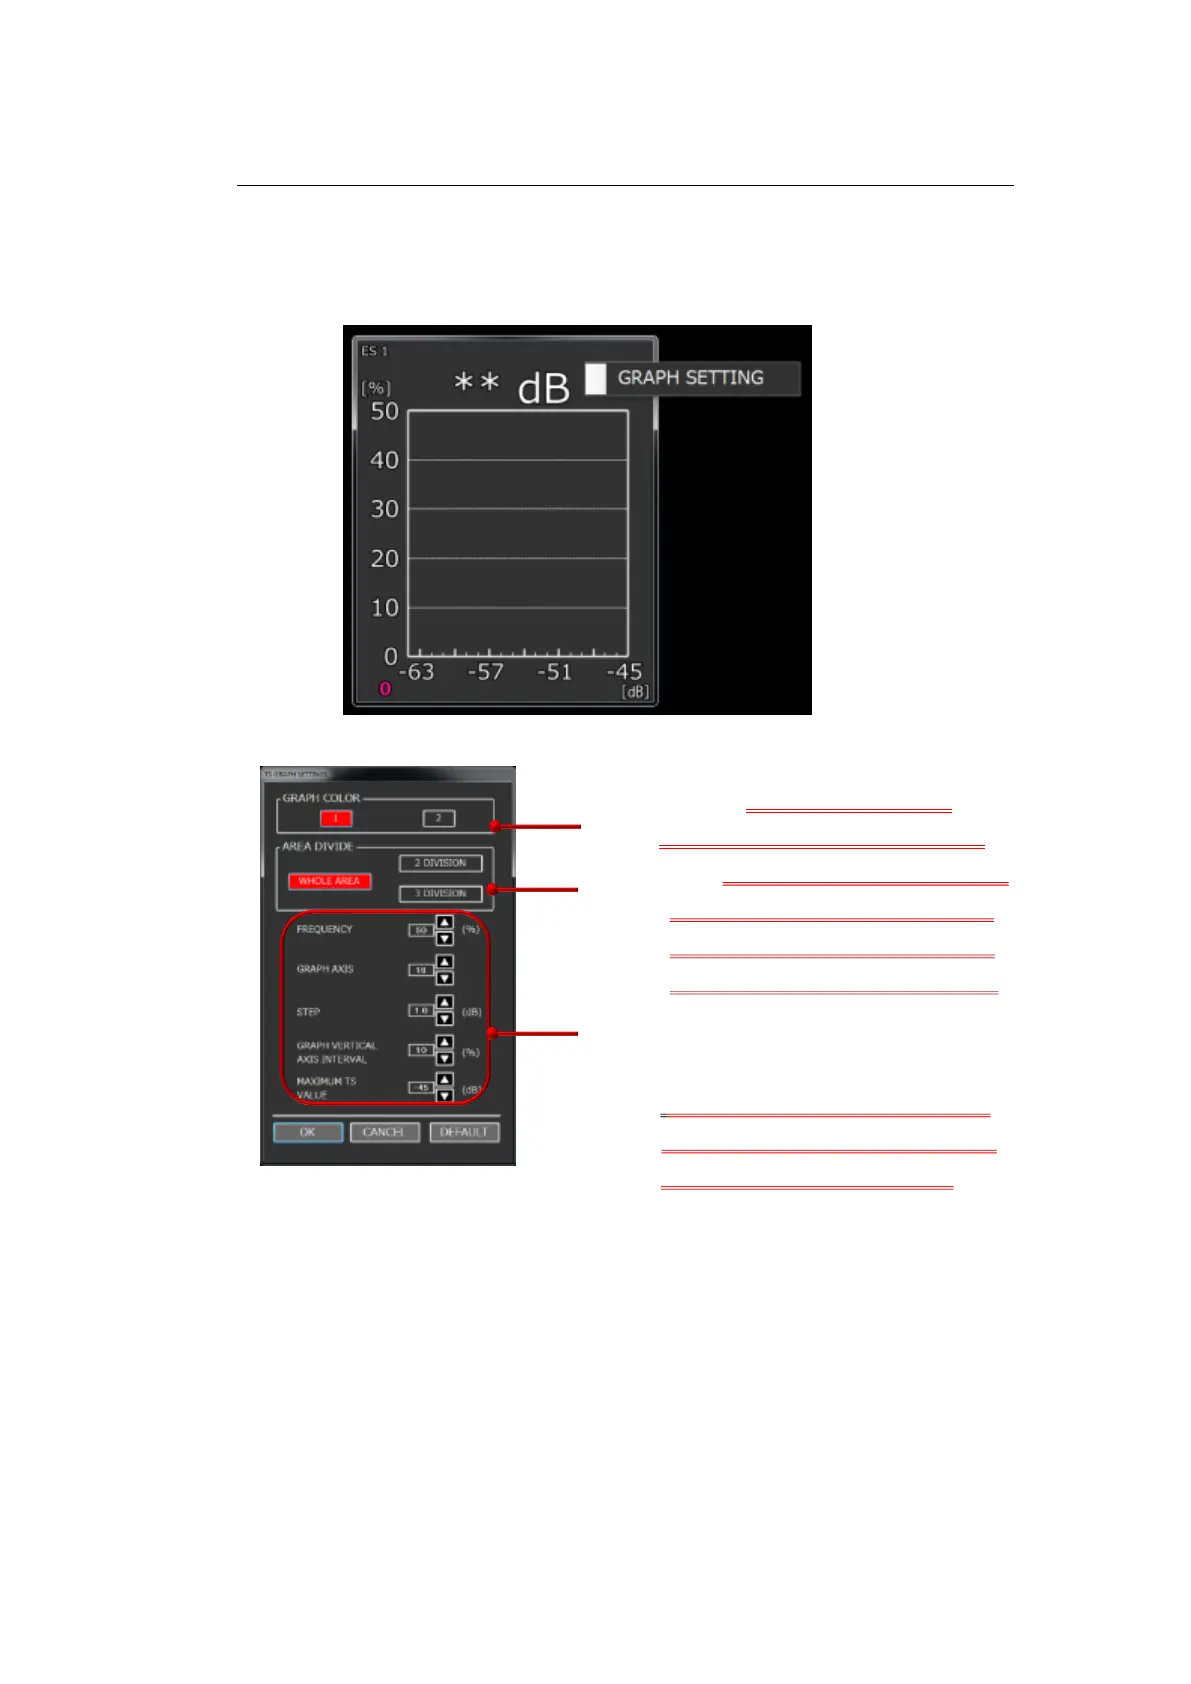
Fig. 2-43 TS GRAPH SETTING screen
GRAPH COLOR: The graph color of the
minimum fish length can be changed
AREA DIVIDE: The detection areas of both the
fish length and the TS value can be
divided, and the TS GRAPH can be
linked to the FISH LENGTH GRAPH.
頻 FREQUENCY, GRAPH AXIS, STEP, GRAPH
VERTICAL AXIS INTERVAL, MAXIMUM TS
VALUE: These settings can be changed like
those of the FISH LENGTH GRAPH.
(For details, see Section 2-10-2.)