II-41
2-11-2 Trace graph display area
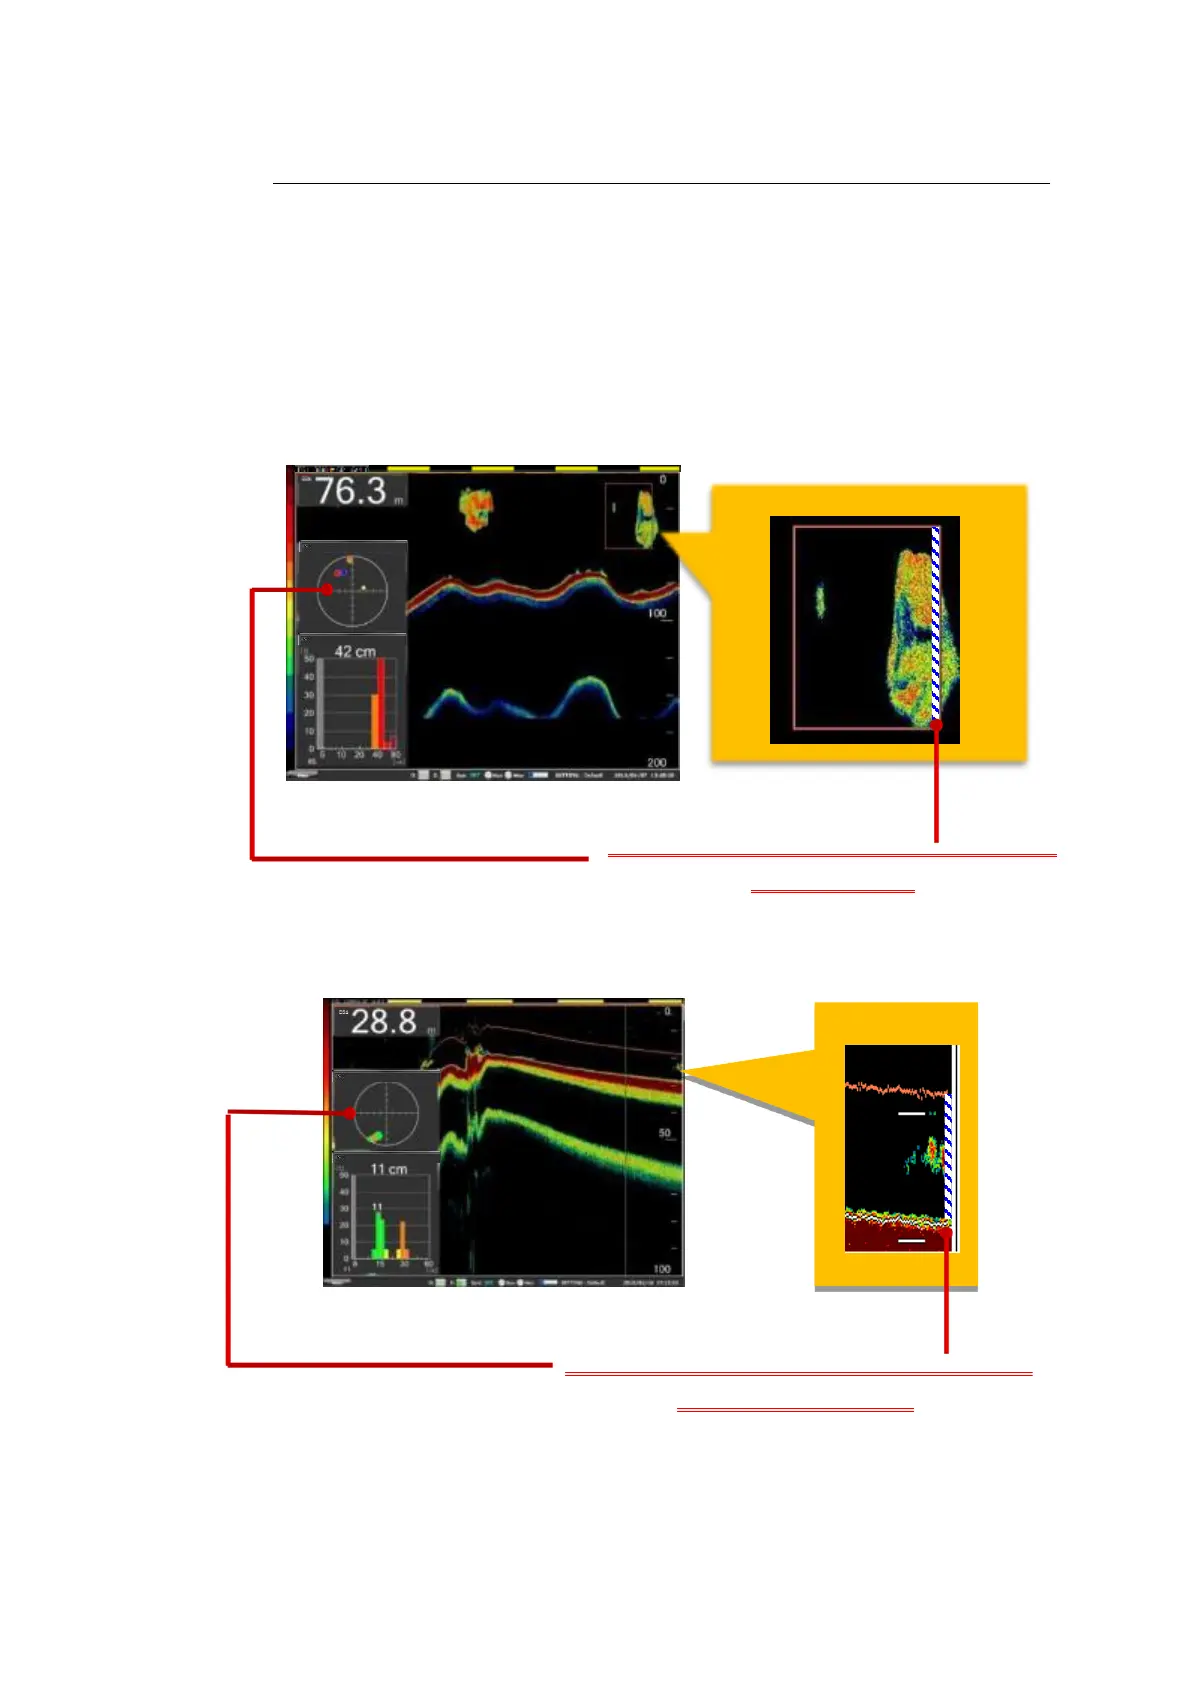
The area displayed by the trace graph is linked to the selection method of the
FISH LENGTH GRAPH. The figure below shows relationship between the
selection method of the FISH LENGTH GRAPH and the data location to be echo-
traced (displayed with a blue diagonal line).
Fig. 2-45 Voluntary fix trace graph display area
Fig. 2-46 Fix sea bottom trace graph display area