II-22
2-10 Use of FISH LENGTH GRAPH and TS
GRAPH
FISH LENGTH GRAPH and TS GRAPH use a histogram to display the size and
percentage of the fish within the specified range, in cm units and TS values. This
graph gives an indication of the fish length during fishing. To display FISH
LENGTH GRAPH and TS GRAPH, follow the procedure given in Fig. 2-29-1
below. (The size of the graphs can be changed unreservedly.)
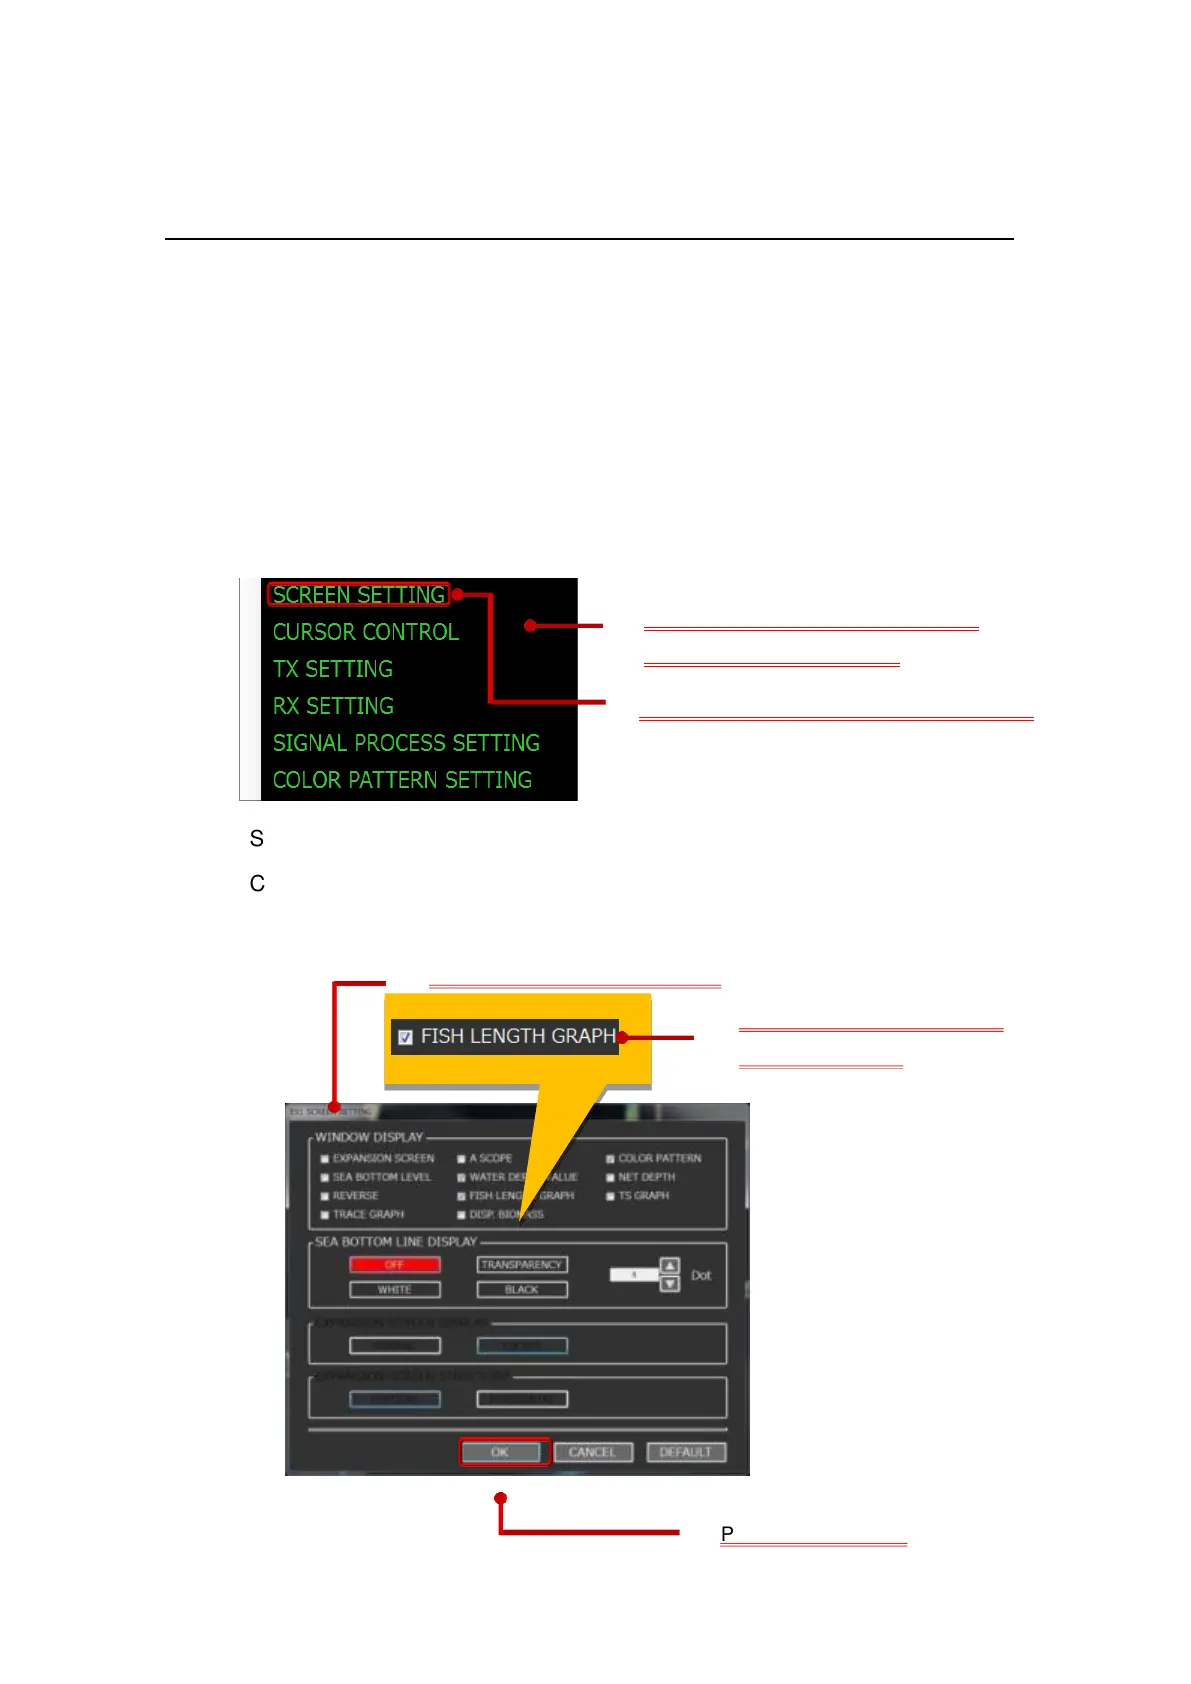
SCREEN SETTING is displayed (the screen is the split beam screen).
Check the checkbox of FISH LENGTH GRAPH in the WINDOW DISPLAY.
.
Check the checkbox of FISH
LENGTH GRAPH.
SCREEN SETTING is displayed.
Press the R key to display the shortcut menu.
Using the R key, display the shortcut
menu in the ES display area.
Press the L or R key on SCREEN SETTING.