II-76
2-16-5 Calibration ball trace graph
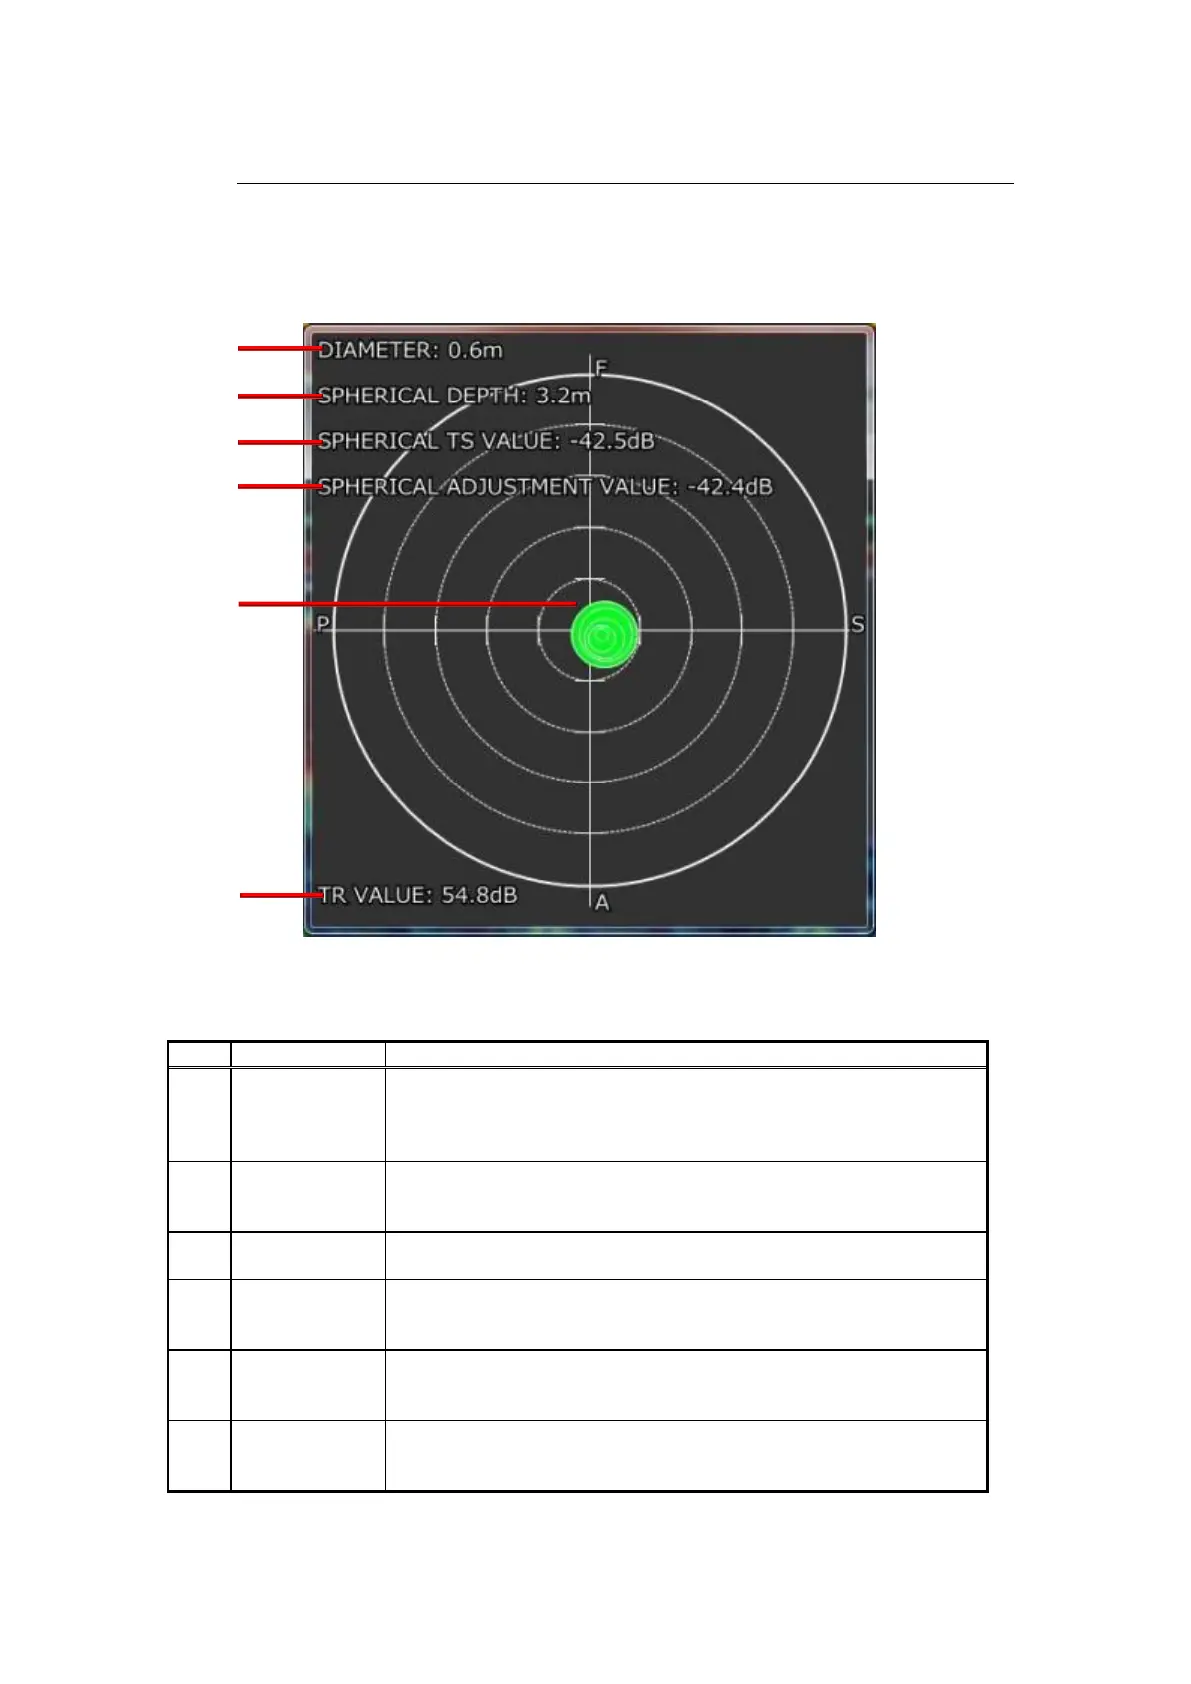
Figure 2-83 shows the calibration ball trace graph window. Table 2-7 shows
the setting items of this window.
Fig. 2-83 Calibration ball trace graph window
Table 2-7 Calibration ball trace window items
Finds the diameter by the following formula:
Diameter = Tan (cutoff angle) x Ball depth x 2
*The draft is not included in the spherical depth obtained by this
diameter calculation.
Displays the ball depth taking account of the draft correction.
It can be found from the data of the single waveform that is judged
to be the ball obtained by the single waveform detection.
Displays the TR value calculation result obtained from the
start.
Displays the Efna value (TS value before correction) of the data
that is judged as the ball position obtained by the single wave from
detection.
SPHERICAL
ADJUSTMENT
VALUE
Displays the TS value after correction of the calibration ball.
Displays the calibration ball position obtained by single waveform
detection.
An adjustment is made to bring the ball in the center.