II-77
2-16-6 TR graph window
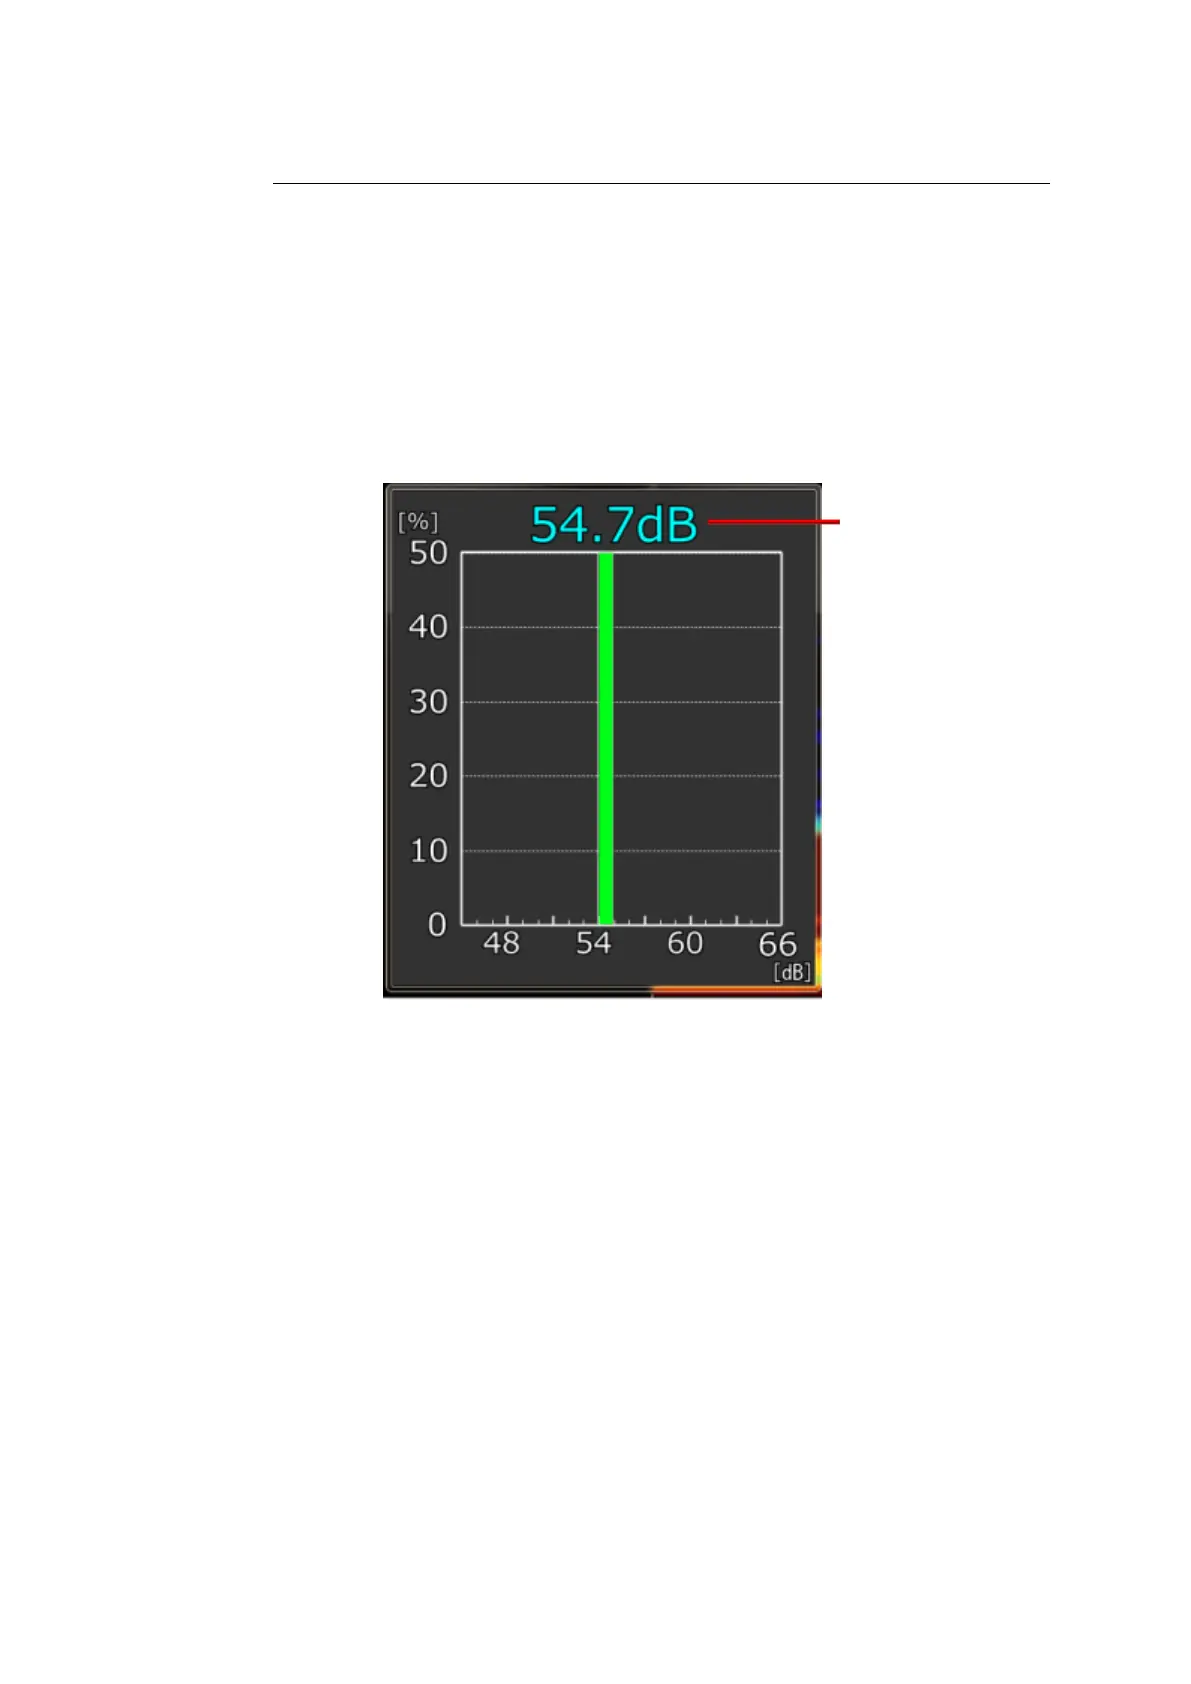
Figure 2-84 shows the TR graph window.
The horizontal axis shows the TR values, and the vertical axis shows the
occurrence frequencies in percentages.
The current TR value is shown in the upper part (1) of the graph. The collection
progress of the current TR value is shown by color change.
The color changes from red → yellow → blue. The calibration is completed
when the TR value is shown in blue.
Fig. 2-84 TR graph window