II-34
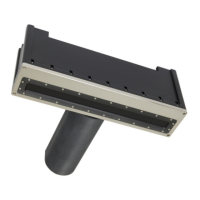
Fig. 2-37 FISH LENGTH GRAPH: Changing the graph intervals (5 -25/in steps of 1)
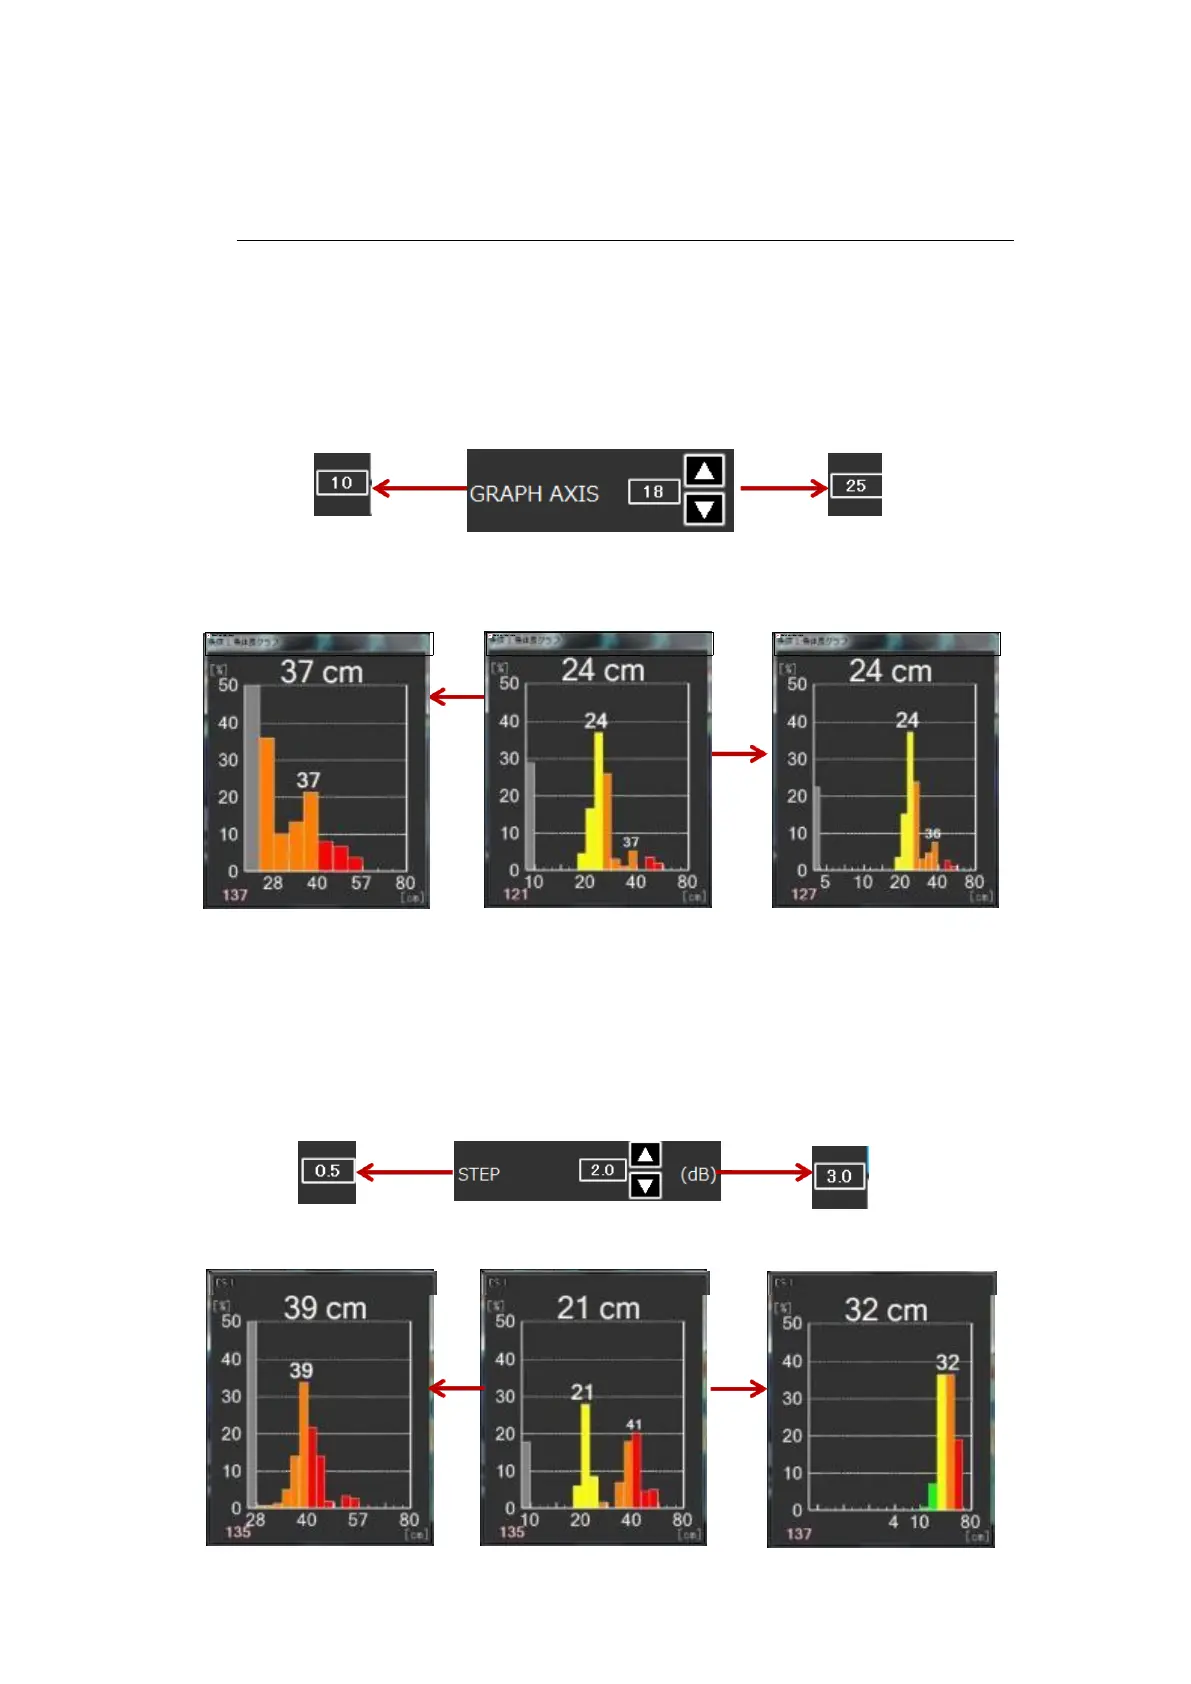
2-10-2-2 Changing the horizontal axis
If the horizontal axis is changed when the distribution of the fish length to be
measured is wide or when it is narrow, the graph becomes easy to see.
In the GRAPH AXIS, the numbers on the horizontal axis can be changed. To
know the fish length in detail, it is recommended to increase the value. To know
the approximate fish length, it is recommended to decrease the value.
Fig. 2-38 FISH LENGTH GRAPH: Changing the graph axis (10 - 25/in steps of 1)
In the STEP, the dB value per division can be changed. When the target fish
is relatively large, it is recommended to decrease the dB value. When the target
fish is small, it is recommended to increase the value.