7–6 Tables
82533C~1.DOC TI-83 international English Bob Fedorisko Revised: 10/26/05 1:24 PM Printed: 10/27/05 2:20
PM Page 6 of 6
If Indpnt: Auto is selected, you can press } and † in the
independent-variable column to display more values. As you
scroll the column, the corresponding dependent-variable values
also are displayed. All dependent-variable values may not be
displayed if
Depend: Ask is selected.
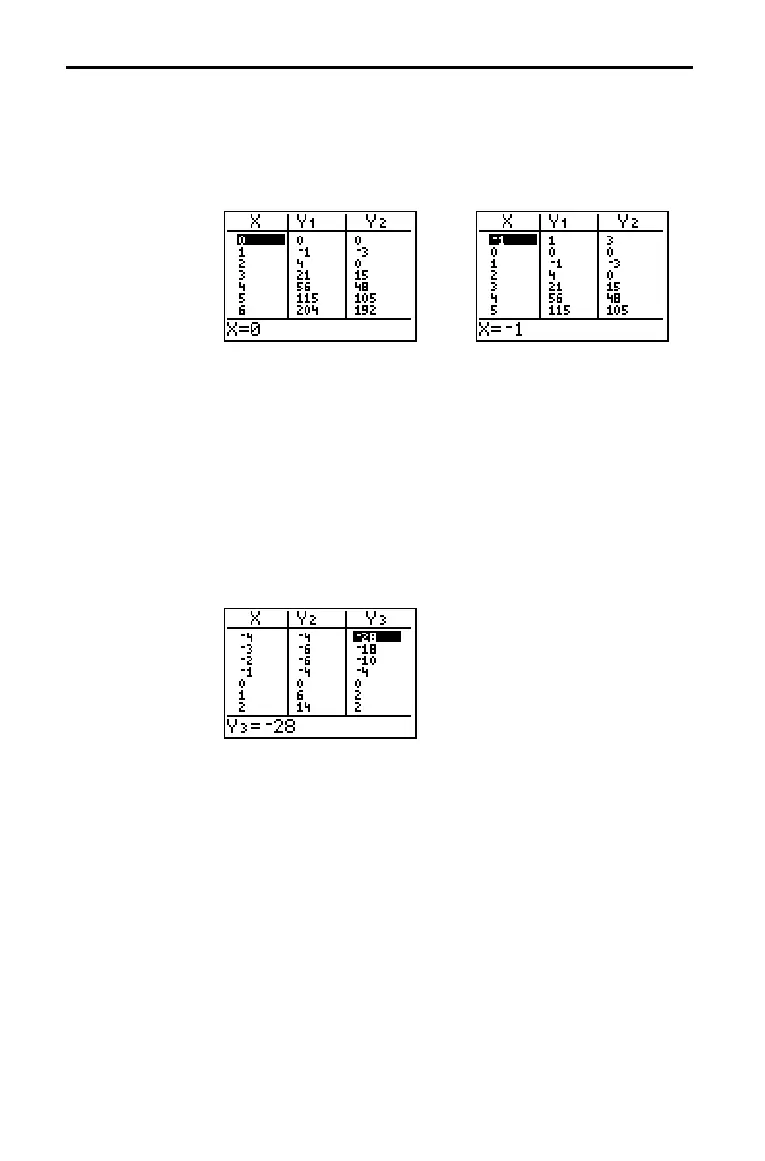
Note: You can scroll back from the value entered for TblStart. As
you scroll, TblStart is updated automatically to the value shown on
the top line of the table. In the example above, TblStart=0 and
@Tbl=1 generates and displays values of X=0, . . . , 6; but you can
press } to scroll back and display the table for X=M1, . . ., 5.
If you have defined more than two dependent variables, the first
two selected
Y= functions are displayed initially. Press ~ or |
to display dependent variables defined by other selected
Y=
functions. The independent variable always remains in the left
column, except during a trace with
Par graphing mode and G.T
split-screen mode set.
Tip: To simultaneously display on the table two dependent variables
that are not defined as consecutive Y= functions, go to the Y= editor
and deselect the Y= functions between the two you want to display.
For example, to simultaneously display Y4 and Y7 on the table, go to
the Y= editor and deselect Y5 and Y6.
Displaying the Table (continued)
Scrolling
Independent-
Variable Values
Displaying Other
Dependent
Variables

 Loading...


