3.2 Function Graphing
82533F~1.DOC TI-83 international English Bob Fedorisko Revised: 10/26/05 1:20 PM Printed: 10/27/05 1:55
PM Page 2 of 28
82533F~1.DOC TI-83 international English Bob Fedorisko Revised: 10/26/05 1:20 PM Printed: 10/27/05 1:55
PM Page 2 of 28
Getting Started is a fast-paced introduction. Read the chapter for details.
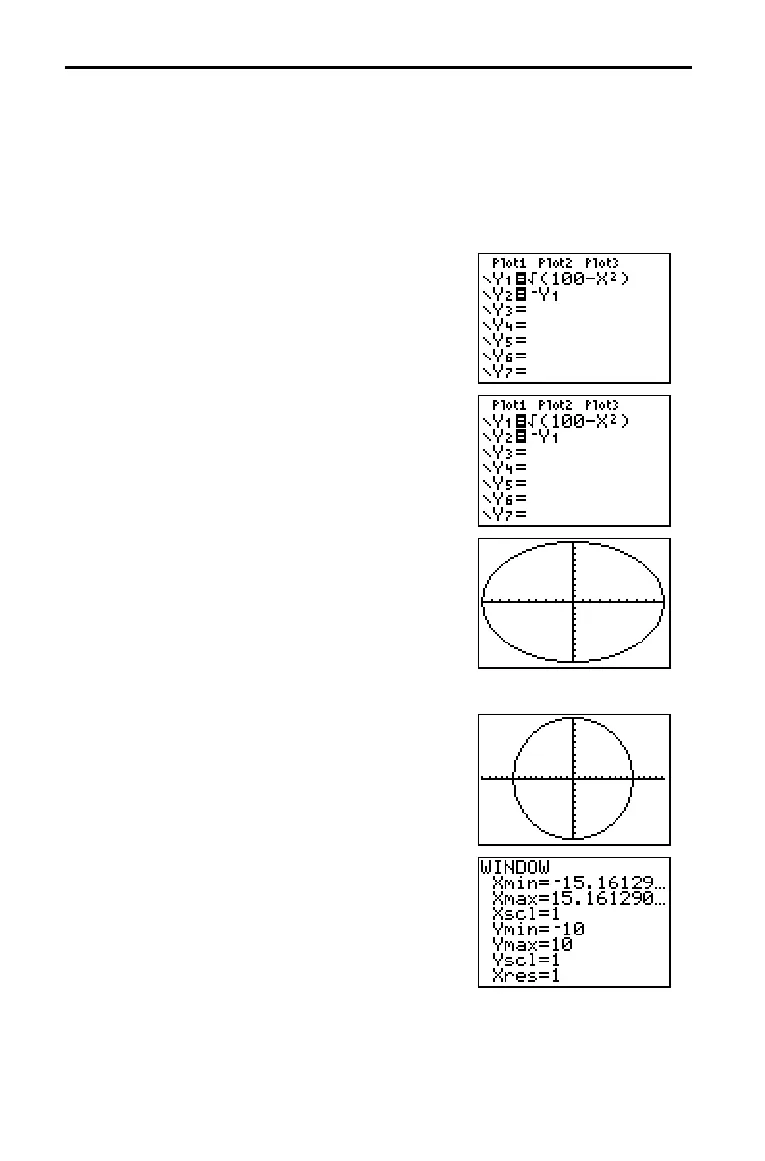
Graph a circle of radius 10, centered on the origin in the standard viewing window.
To graph this circle, you must enter separate formulas for the upper and lower
portions of the circle. Then use
ZSquare (zoom square) to adjust the display and
make the functions appear as a circle.
1. In Func mode, press o to display the
Y= editor. Press y ã‡ä 100 ¹ „ ¡ ¤
Í to enter the expression Y=
(100NX
2
),
which defines the top half of the circle.
The expression Y=L
(100NX
2
) defines the
ottom half of the circle. On the TI-82 STATS,
you can define one function in terms of another.
To define
Y2=LY1, press Ì to enter the negation
sign. Press ~ to display the
VARS Y.VARS menu. Then press Í to
select
1:Function. The FUNCTION secondary
menu is displayed. Press
1 to select 1:Y1.
2. Press q 6 to select 6:ZStandard. This is a
quick way to reset the window variables to the
standard values. It also graphs the functions;
you do not need to press s.
Notice that the functions appear as an ellipse in
the standard viewing window.
3. To adjust the display so that each pixel
represents an equal width and height, press
q
5 to select 5:ZSquare. The functions are
replotted and now appear as a circle on the
display.
4. To see the ZSquare window variables, press
p and notice the new values for
Xmin,
Xmax, Ymin, and Ymax.
Getting Started: Graphing a Circle

 Loading...


