Split Screen 9–5
8253D2~1.DOC TI-83 international English Bob Fedorisko Revised: 10/28/05 9:26 AM Printed: 10/28/05 9:26
M Page 5 of 6
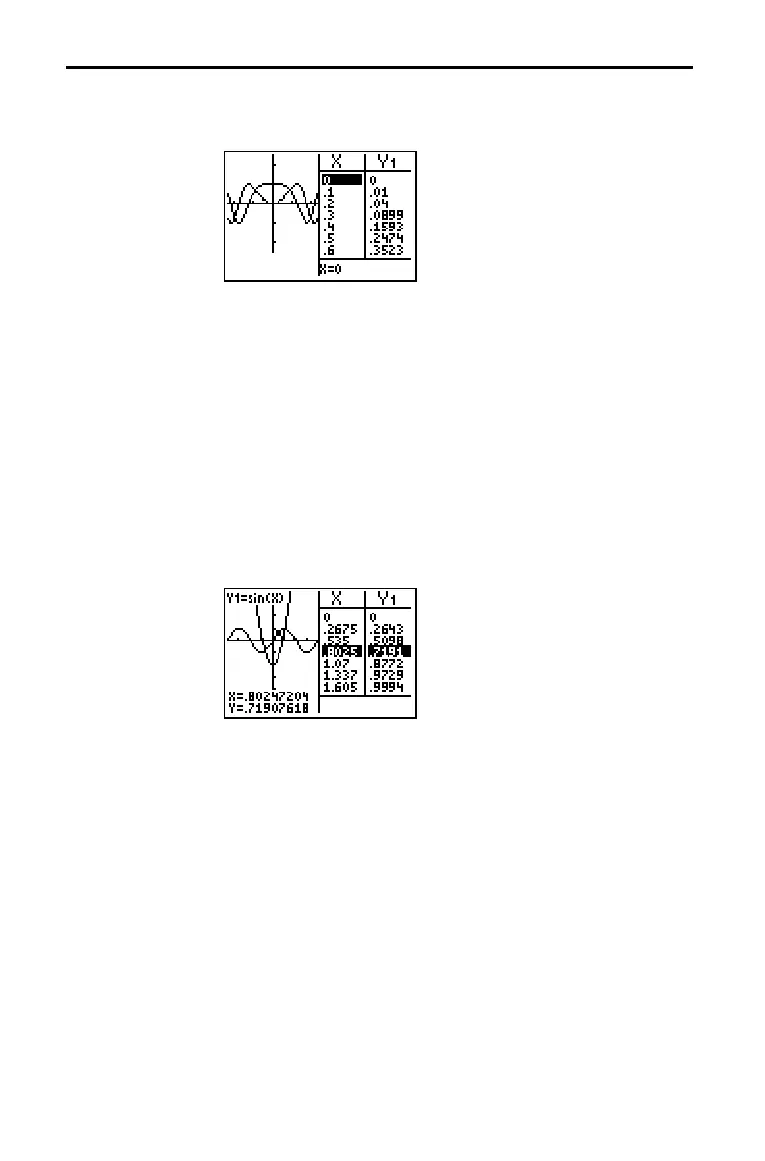
In G.T (graph-table) split-screen mode, a vertical line splits the
screen into left and right halves.
The left half displays the graph.
The right half displays the table.
To use the left half of the split screen:
• Press s or r.
• Select a
ZOOM or CALC operation.
To use the right half of the split screen, press y [TABLE].
As you move the trace cursor along a graph in the split screen’s
left half in
G.T mode, the table on the right half automatically
scrolls to match the current cursor values.
Note: When you trace in Par graphing mode, both components of an
equation (XnT and YnT) are displayed in the two columns of the table.
As you trace, the current value of the independent variable
T is
displayed on the graph.
All screens other than the graph and the table are displayed as
full screens in
G.T split-screen mode.
To return to the
G.T split screen from a full screen when in G.T
mode, press any key or key combination that displays the graph
or the table.
G.T (Graph-Table) Split Screen
G.T Mode
Moving from Half
to Half in G.T
Mode
Using r
rr
r in
G.T Mode
Full Screens in
G.T Mode

 Loading...


