8–10 DRAW Instructions
82CA5D~1.DOC TI-83 international English Bob Fedorisko Revised: 10/26/05 1:27 PM Printed: 10/27/05 2:36
PM Page 10 of 20
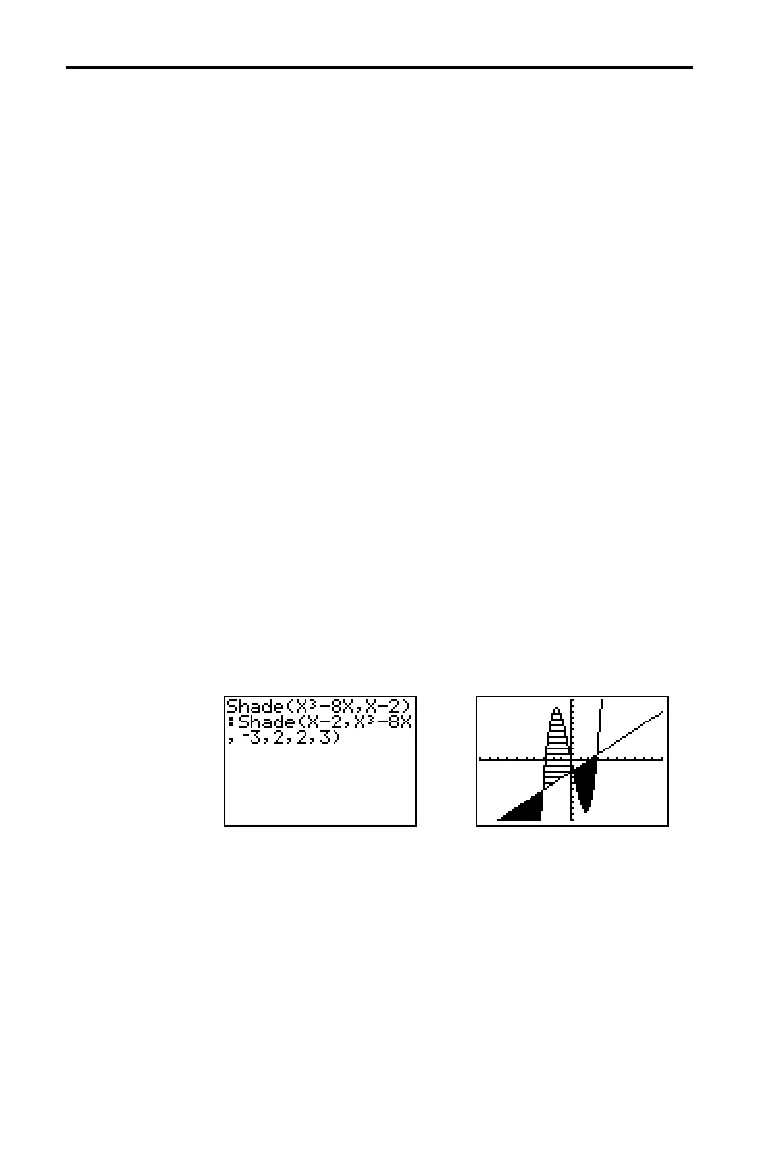
To shade an area on a graph, select 7:Shade( from the DRAW
menu. The instruction is pasted to the home screen or to the
program editor.
Shade( draws lowerfunc and upperfunc in terms of X on the
current graph and shades the area that is specifically above
lowerfunc and below upperfunc. Only the areas where lowerfunc
< upperfunc are shaded.
Xleft and Xright, if included, specify left and right boundaries
for the shading. Xleft and Xright must be numbers between
Xmin and Xmax, which are the defaults.
pattern specifies one of four shading patterns.
pattern=1 vertical (default)
pattern=
2 horizontal
pattern=
3 negative—slope 45¡
pattern=
4 positive—slope 45¡
patres specifies one of eight shading resolutions.
patres=1 shades every pixel (default)
patres=
2 shades every second pixel
patres=
3 shades every third pixel
patres=
4 shades every fourth pixel
patres=
5 shades every fifth pixel
patres=
6 shades every sixth pixel
patres=
7 shades every seventh pixel
patres=
8 shades every eighth pixel
Shade(lowerfunc,upperfunc[,Xleft,Xright,pattern,patres])
Shading Areas on a Graph
Shading a Graph

 Loading...


