3.4 Function Graphing
82533F~1.DOC TI-83 international English Bob Fedorisko Revised: 10/26/05 1:20 PM Printed: 10/27/05 1:55
PM Page 4 of 28
82533F~1.DOC TI-83 international English Bob Fedorisko Revised: 10/26/05 1:20 PM Printed: 10/27/05 1:55
PM Page 4 of 28
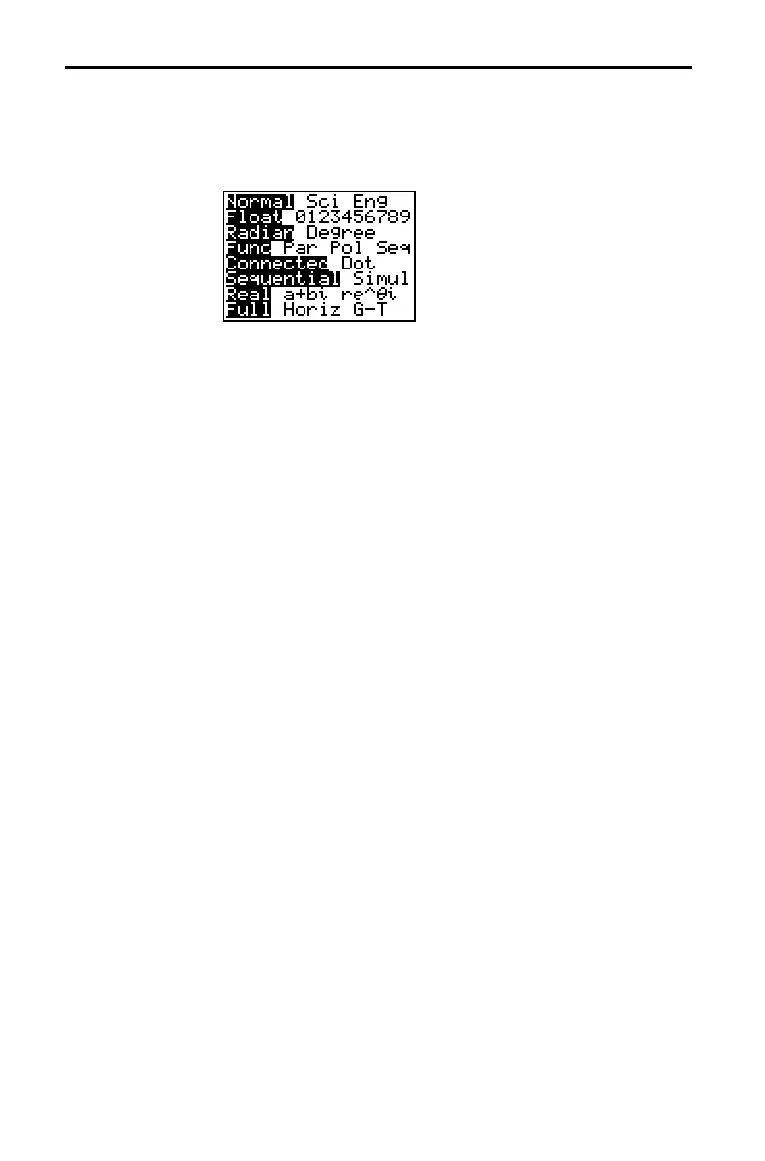
To display the mode screen, press z. The default settings are
highlighted below. To graph functions, you must select
Func
mode before you enter values for the window variables and
before you enter the functions.
The TI-82 STATS has four graphing modes.
• Func (function graphing)
•
Par (parametric graphing; Chapter 4)
•
Pol (polar graphing; Chapter 5)
•
Seq (sequence graphing; Chapter 6)
Other mode settings affect graphing results. Chapter 1 describes
each mode setting.
• Float or 0123456789 (fixed) decimal mode affects displayed
graph coordinates.
•
Radian or Degree angle mode affects interpretation of some
functions.
•
Connected or Dot plotting mode affects plotting of selected
functions.
•
Sequential or Simul graphing-order mode affects function
plotting when more than one function is selected.
To set the graphing mode and other modes from a program,
begin on a blank line in the program editor and follow these
steps.
1. Press z to display the mode settings.
2. Press †, ~, |, and } to place the cursor on the mode that
you want to select.
3. Press Í to paste the mode name to the cursor location.
The mode is changed when the program is executed.
Setting the Graph Modes
Checking and
Changing the
Graphing Mode
Setting Modes
from a Program