Applications 17–5
82501F~1.DOC TI-83 international English Bob Fedorisko Revised: 10/26/05 1:49 PM Printed: 10/27/05 3:04
PM Page 5 of 20
Graph the inequality 0.4X
3
N 3X + 5 < 0.2X + 4. Use the TEST
menu operations to explore the values of X where the inequality
is true and where it is false.
1. Press z. Select
Dot, Simul, and the default settings.
Setting
Dot mode changes all graph style icons to í (dot) in
the
Y= editor.
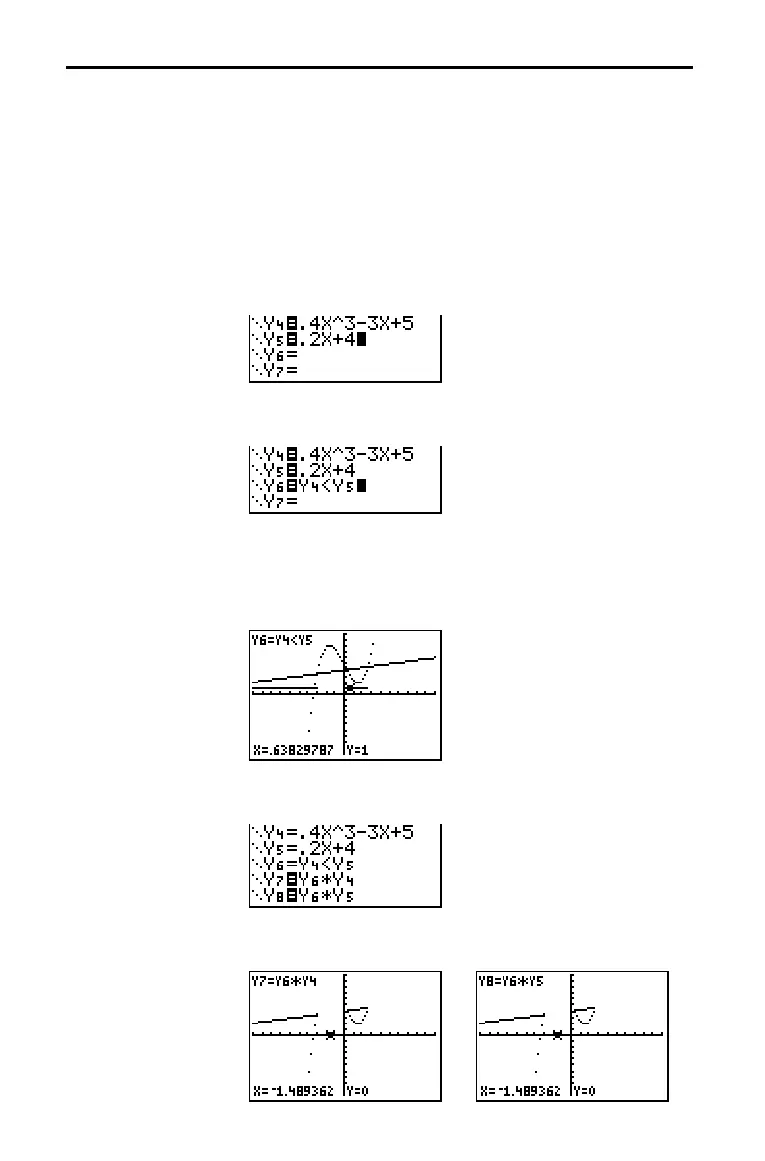
2. Press o. Turn off all functions and stat plots. Enter the left
side of the inequality as
Y4 and the right side as Y5.
3. Enter the statement of the inequality as Y6. This function
evaluates to
1 if true or 0 if false.
4. Press q 6 to graph the inequality in the standard
window.
5. Press r † † to move to
Y6. Then press | and ~ to
trace the inequality, observing the value of
Y.
6. Press o. Turn off Y4, Y5, and Y6. Enter equations to graph
only the inequality.
7. Press r. Notice that the values of Y7 and Y8 are zero
where the inequality is false.
Graphing Inequalities
Problem
Procedure

 Loading...


