17–4 Applications
82501F~1.DOC TI-83 international English Bob Fedorisko Revised: 10/26/05 1:49 PM Printed: 10/27/05 3:04
PM Page 4 of 20
The fine for speeding on a road with a speed limit of 45
kilometers per hour (kph) is 50; plus 5 for each kph from 46 to
55 kph; plus 10 for each kph from 56 to 65 kph; plus 20 for each
kph from 66 kph and above. Graph the piecewise function that
describes the cost of the ticket.
The fine (Y) as a function of kilometers per hour (X) is:
Y = 0 0 < X 45
Y = 50 + 5 (X N 45) 45 < X 55
Y = 50 + 5 … 10 + 10 (X N 55) 55 < X 65
Y = 50 + 5 … 10 + 10 … 10 + 20 (X N 65) 65 < X
1. Press z. Select
Func and the default settings.
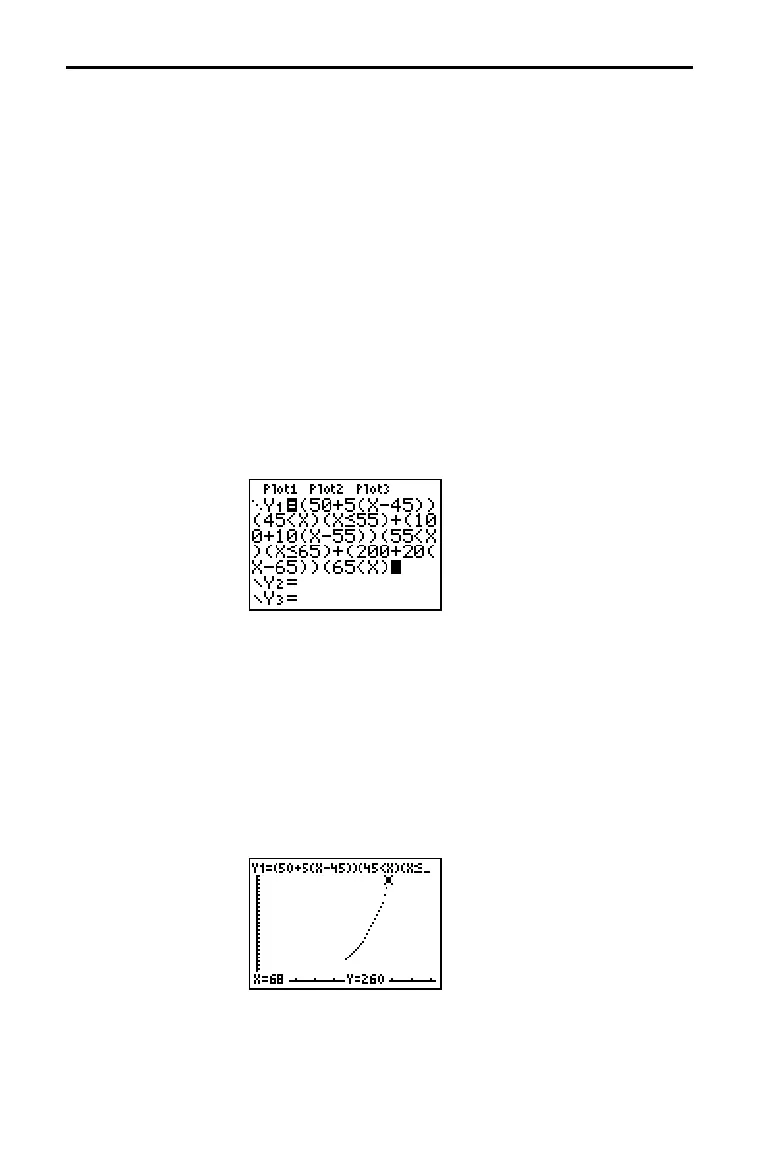
2. Press o. Turn off all functions and stat plots. Enter the
Y= function to describe the fine. Use the TEST menu
operations to define the piecewise function. Set the graph
style for
Y1 to í (dot).
3. Press p and set Xmin=L2, Xscl=10, Ymin=L5, and
Yscl=10. Ignore Xmax and Ymax; they are set by @X and @Y
in step 4.
4. Press y [QUIT] to return to the home screen. Store 1 to @X,
and then store
5 to @Y. @X and @Y are on the VARS Window
X/Y
secondary menu. @X and @Y specify the horizontal and
vertical distance between the centers of adjacent pixels.
Integer values for
@X and @Y produce nice values for tracing.
5. Press r to plot the function. At what speed does the
ticket exceed 250?
Graphing Piecewise Functions
Problem
Procedure

 Loading...


