Tables 7–5
82533C~1.DOC TI-83 international English Bob Fedorisko Revised: 10/26/05 1:24 PM Printed: 10/27/05 2:20
PM Page 5 of 6
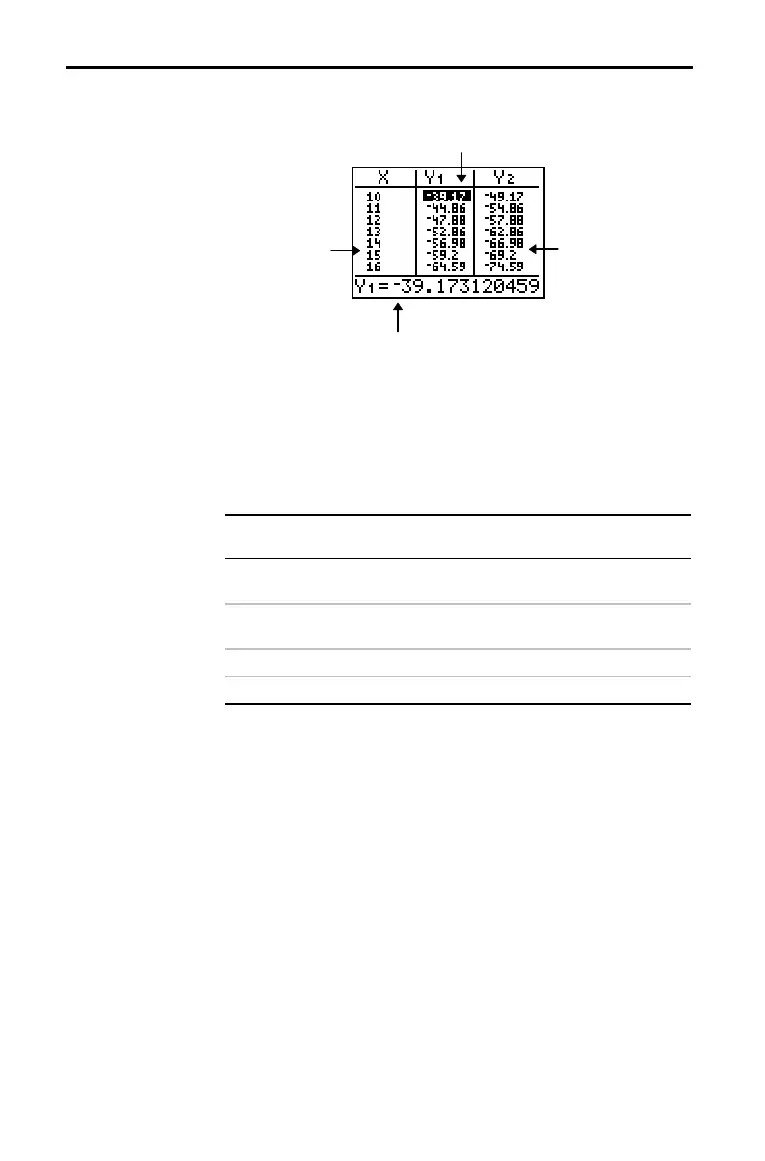
To display the table, press y [TABLE].
Current cell
Independent-
variable values
in the first
column
Dependent-
variable values in
the second and
third columns
Current cell’s full value
Note: The table abbreviates the values, if necessary.
The current graphing mode determines which independent and
dependent variables are displayed in the table (Chapter 1). In the
table above, for example, the independent variable
X and the
dependent variables
Y1 and Y2 are displayed because Func
graphing mode is set.
Graphing Mode Independent
Variable
Dependent
Variable
Func (function) XY1 throu
h Y9, and
Y0
Par (parametric) TX1T
Y1T throu
h
X6T
Y6T
Pol (polar) q r1 through r6
Seq (sequence) nu(n), v(n), and w(n)
From the home screen, select the ClrTable instruction from the
CATALOG. To clear the table, press Í.
From a program, select
9:ClrTable from the PRGM I/O menu or
from the
CATALOG. The table is cleared upon execution. If
IndpntAsk is selected, all independent and dependent variable
values on the table are cleared. If
DependAsk is selected, all
dependent variable values on the table are cleared.
Displaying the Table
The Table
Independent and
Dependent
Variables
Clearing the
Table from the
Home Screen or
a Program

 Loading...


