8–8 DRAW Instructions
82CA5D~1.DOC TI-83 international English Bob Fedorisko Revised: 10/26/05 1:27 PM Printed: 10/27/05 2:36
PM Page 8 of 20
To draw a tangent line when a graph is displayed, follow these
steps.
1. Select
5:Tangent( from the DRAW menu.
2. Press † and } to move the cursor to the function for which
you want to draw the tangent line. The current graph’s
Y=
function is displayed in the top-left corner, if ExprOn is
selected.
3. Press ~ and | or enter a number to select the point on the
function at which you want to draw the tangent line.
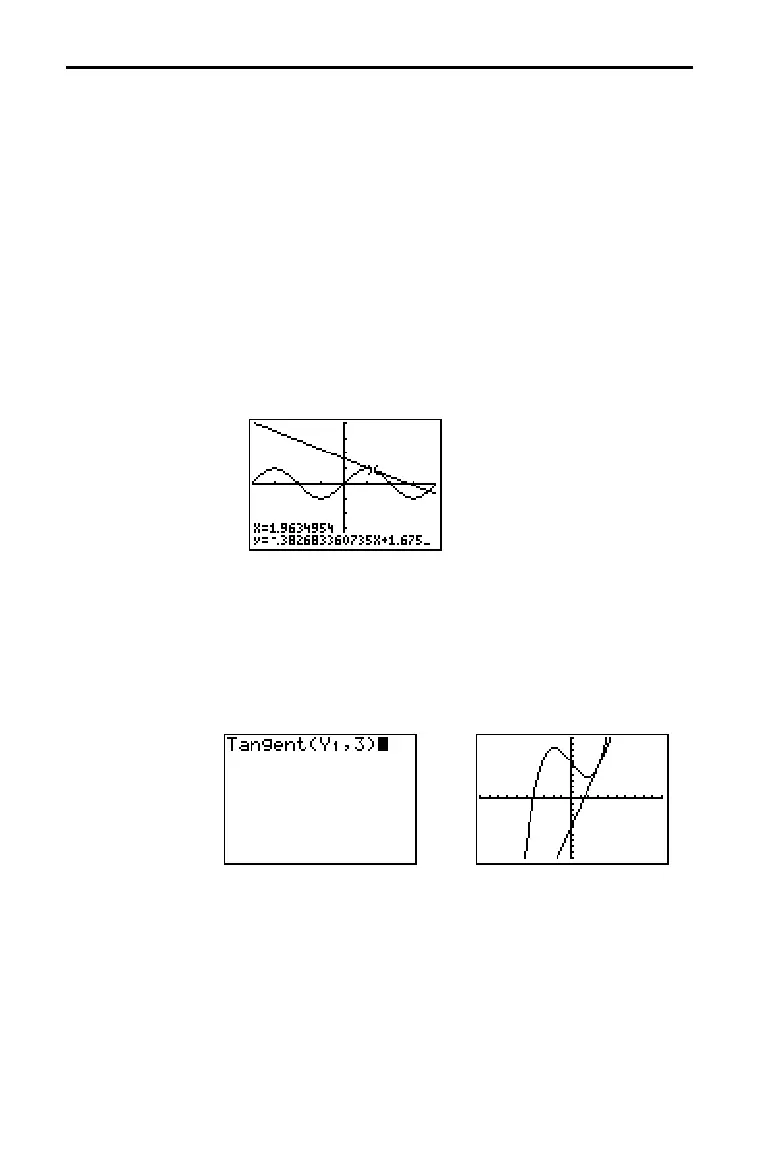
4. Press Í. In
Func mode, the X value at which the tangent
line was drawn is displayed on the bottom of the screen,
along with the equation of the tangent line. In all other
modes, the
dy/dx value is displayed.
Tip: Change the fixed decimal setting on the mode screen if you want
to see fewer digits displayed for X and the equation for Y.
Tangent( (tangent line) draws a line tangent to expression in
terms of
X, such as Y1 or X
2
, at point X=value. X can be an
expression. expression is interpreted as being in
Func mode.
Tangent(expression,value)
Drawing Tangent Lines
Drawing
a Tangent Line
Directly
on a Graph
Drawing
a Tangent Line
from the Home
Screen or
a Program

 Loading...


