17–14 Applications
82501F~1.DOC TI-83 international English Bob Fedorisko Revised: 10/26/05 1:49 PM Printed: 10/27/05 3:04
PM Page 14 of 20
Using the functions fnInt( and nDeriv( from the MATH menu to
graph functions defined by integrals and derivatives
demonstrates graphically that:
F(x) =
‰
1
x
1àt dt = ln(x), x > 0 and that
D
x
[‰
1
x
1àt dt] = 1àx
1. Press z. Select the default settings.
2. Press p. Set the viewing window.
Xmin=.01 Ymin=M1.5 Xres=3
Xmax=10 Ymax=2.5
Xscl=1 Yscl=1
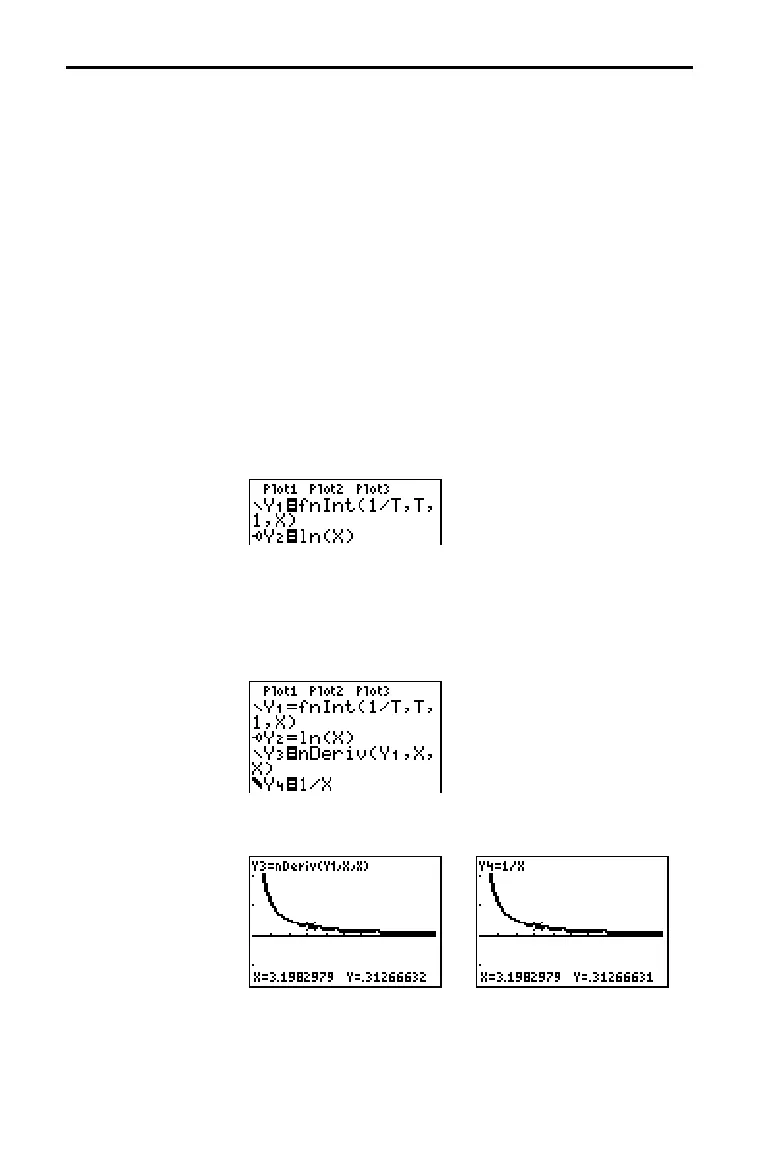
3. Press o. Turn off all functions and stat plots. Enter the
numerical integral of 1àT from 1 to X and the function
ln(X). Set the graph style for
Y1 to ç (line) and Y2 to
ë (path).
4. Press r. Press |, }, ~, and † to compare the values
of
Y1 and Y2.
5. Press o. Turn off Y1 and Y2, and then enter the numerical
derivative of the integral of 1àX and the function 1àX. Set
the graph style for
Y3 to ç
çç
ç (line) and Y4 to è
èè
è (thick).
6. Press r. Again, use the cursor keys to compare the
values of the two graphed functions,
Y3 and Y4.
Demonstrating the Fundamental Theorem of Calculus
Problem 1
Procedure 1

 Loading...


