12 Getting Started
82STAT~1.DOC TI-83 international English Bob Fedorisko Revised: 10/27/05 1:33 PM Printed: 10/27/05 3:30
PM Page 12 of 18
You also can use the graphing features of the TI-82 STATS to find the maximum
value of a previously defined function. When the graph is activated, the viewing
window defines the displayed portion of the coordinate plane. The values of the
window variables determine the size of the viewing window.
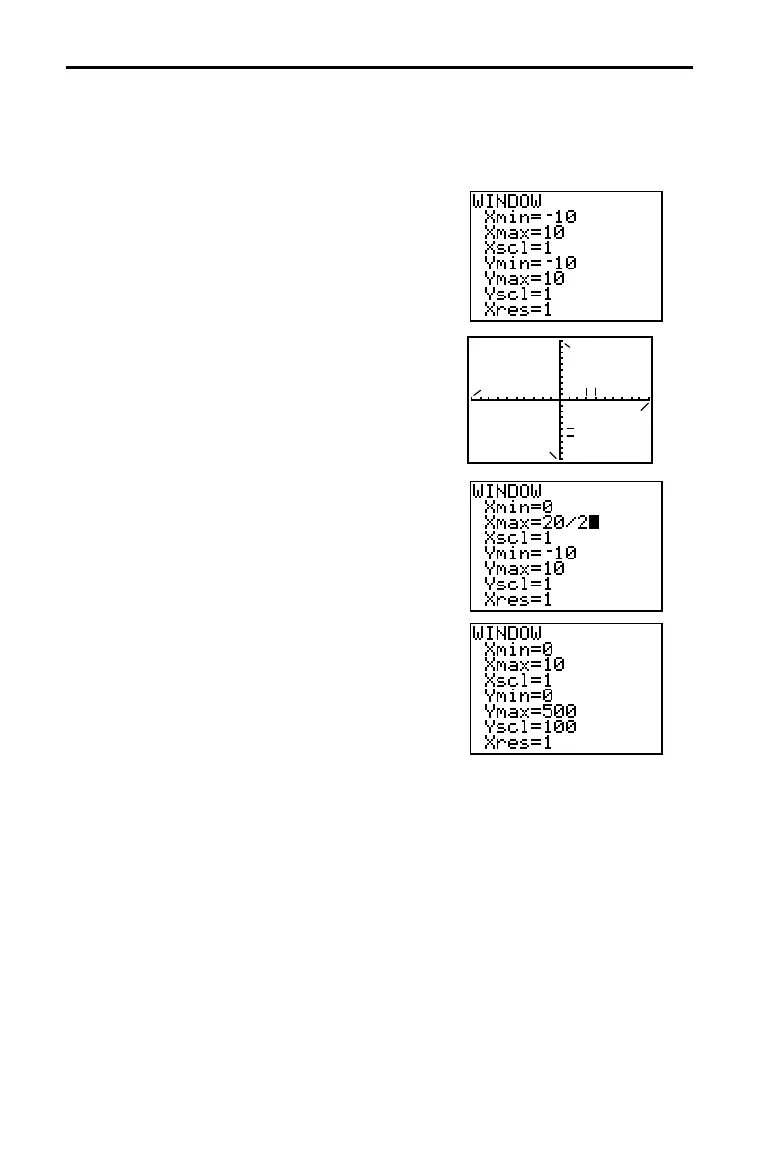
1. Press p to display the window editor,
where you can view and edit the values of the
window variables.
The standard window variables define the
viewing window as shown.
Xmin, Xmax,
Ymin, and Ymax define the boundaries of the
display.
Xscl and Yscl define the distance
etween tick marks on the X and Y axes. Xres
controls resolution.
Xmax
Ymin
Ymax
Xscl
Yscl
Xmin
2. Press 0 Í to define Xmin.
3. Press 20 ¥ 2 to define Xmax using an
expression.
4. Press Í. The expression is evaluated, and
10 is stored in Xmax. Press Í to accept
Xscl as 1.
5. Press 0 Í 500 Í 100 Í 1 Í
to define the remaining window variables.
Setting the Viewing Window: Box with Lid

 Loading...


