3.18 Function Graphing
82533F~1.DOC TI-83 international English Bob Fedorisko Revised: 10/26/05 1:20 PM Printed: 10/27/05 1:55
PM Page 18 of 28
82533F~1.DOC TI-83 international English Bob Fedorisko Revised: 10/26/05 1:20 PM Printed: 10/27/05 1:55
PM Page 18 of 28
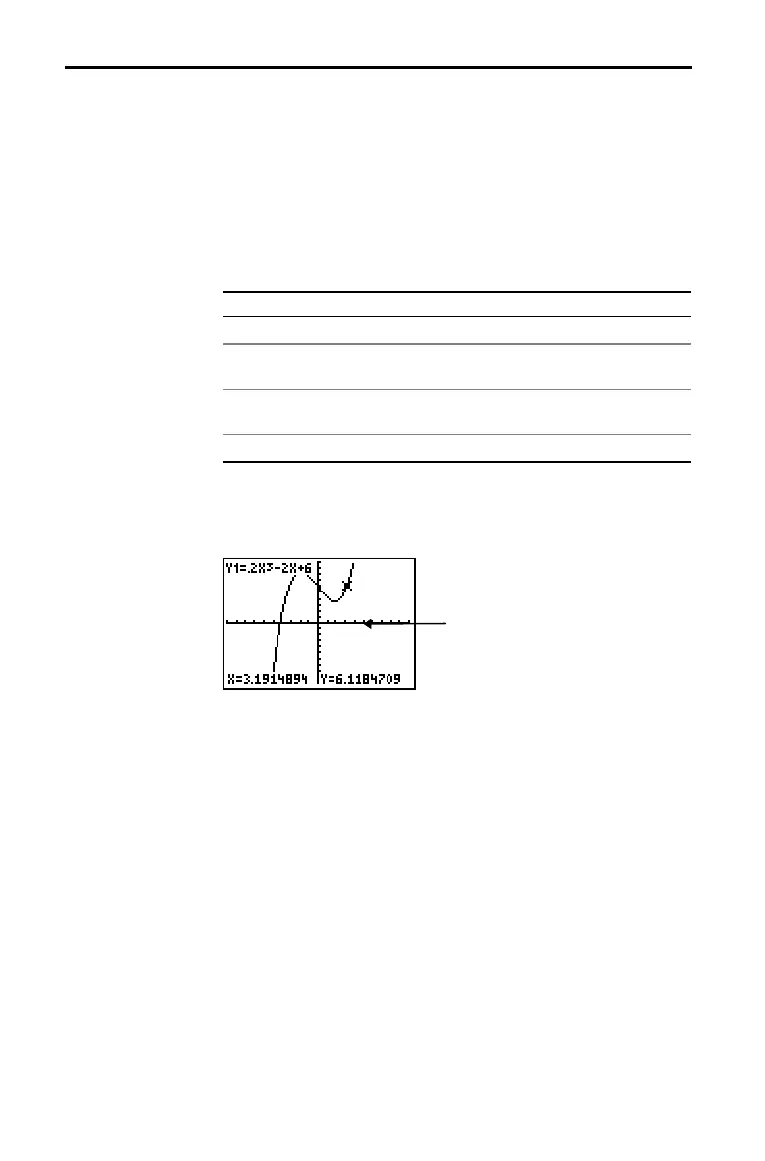
Use TRACE to move the cursor from one plotted point to the
next along a function. To begin a trace, press r. If the
graph is not displayed already, press r to display it. The
trace cursor is on the first selected function in the
Y= editor, at
the middle
X value on the screen. The cursor coordinates are
displayed at the bottom of the screen if
CoordOn format is
selected. The
Y= expression is displayed in the top-left corner of
the screen, if
ExprOn format is selected.
To move the TRACE cursor . . . do this:
. . . to the previous or next plotted point, press | or ~.
. . . five
lotted
oints on a function
Xres
affects this),
ress y | or y
~.
. . . to any valid X value on a function, enter a value, and
then press Í.
. . . from one function to another, press } or †.
When the trace cursor moves along a function, the
Y value is
calculated from the
X value; that is, Y=Yn(X). If the function is
undefined at an
X value, the Y value is blank.
If you move the trace cursor beyond the top or bottom of the
screen, the coordinate values at the bottom of the screen
continue to change appropriately.
To move the trace cursor from function to function, press † and
}. The cursor follows the order of the selected functions in the
Y= editor. The trace cursor moves to each function at the same X
value. If ExprOn format is selected, the expression is updated.
Exploring Graphs with TRACE
Beginning a
Trace
Moving the Trace
Cursor
Moving the Trace
Cursor from
Function to
Function
Trace cursor on the curve

 Loading...


