Statistics 12–37
82D315~1.DOC TI-83 international English Bob Fedorisko Revised: 10/26/05 1:36 PM Printed: 10/27/05 2:53
PM Page 37 of 38
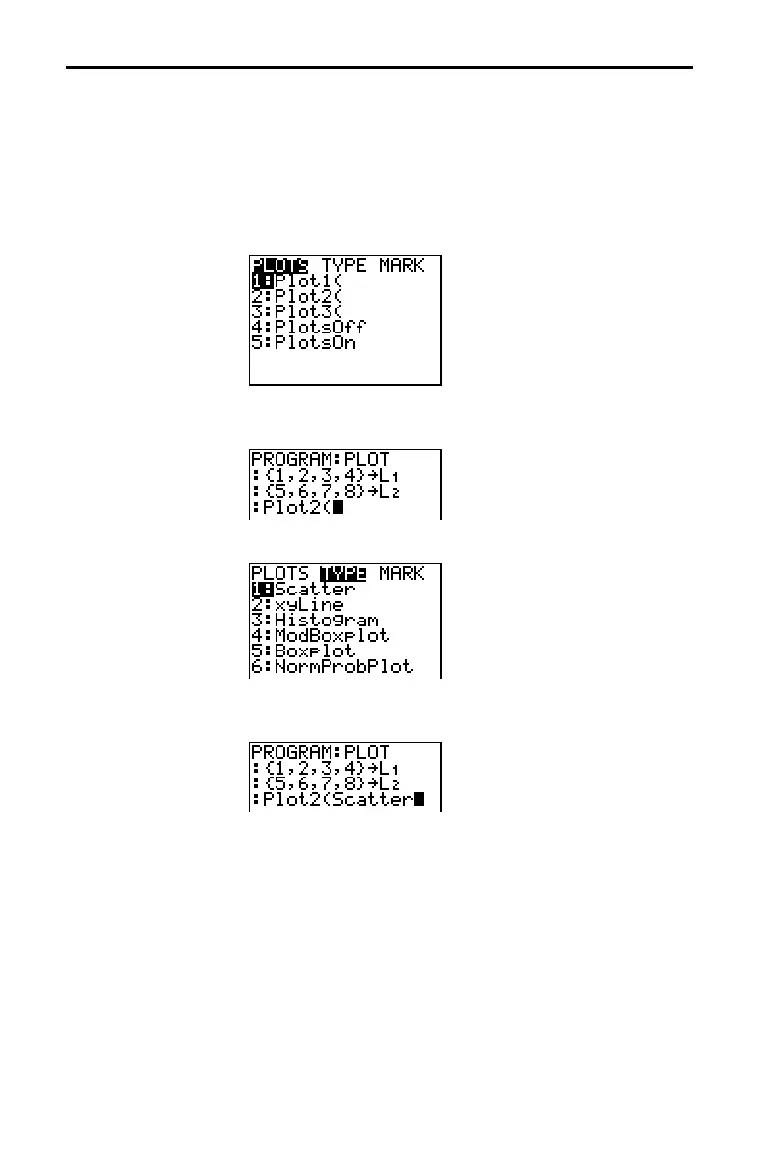
To display a stat plot from a program, define the plot, and then
display the graph.
To define a stat plot from a program, begin on a blank line in
the program editor and enter data into one or more lists; then,
follow these steps.
1. Press y [
STAT PLOT] to display the STAT PLOTS menu.
2. Select the plot to define, which pastes Plot1(, Plot2(, or
Plot3( to the cursor location.
3. Press y [STAT PLOT] ~ to display the STAT TYPE menu.
4. Select the type of plot, which pastes the name of the plot
type to the cursor location.
Statistical Plotting in a Program
Defining a Stat
Plot in a Program

 Loading...


