Statistics 12–25
82D315~1.DOC TI-83 international English Bob Fedorisko Revised: 10/26/05 1:36 PM Printed: 10/27/05 2:53
PM Page 25 of 38
1.Var Stats (one-variable statistics) analyzes data with one
measured variable. Each element in freqlist is the frequency of
occurrence for each corresponding data point in Xlistname.
freqlist elements must be real numbers > 0.
1.Var Stats [Xlistname,freqlist]
2.Var Stats (two-variable statistics) analyzes paired data.
Xlistname is the independent variable. Ylistname is the
dependent variable. Each element in freqlist is the frequency of
occurrence for each data pair (Xlistname,Ylistname).
2.Var Stats [Xlistname,Ylistname,freqlist]
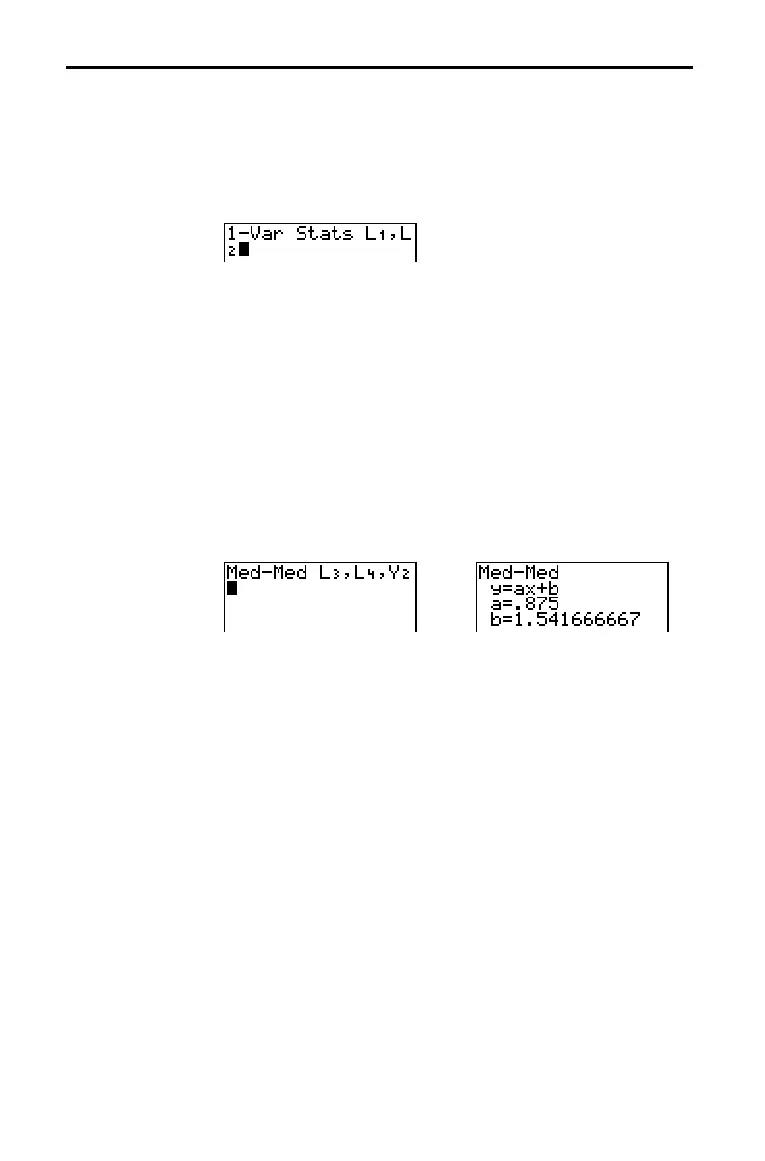
Med.Med (median-median) fits the model equation y=ax+b to
the data using the median-median line (resistant line) technique,
calculating the summary points
x1, y1, x2, y2, x3, and y3.
Med.Med displays values for a (slope) and b (y-intercept).
Med.Med [Xlistname,Ylistname,freqlist,regequ]
LinReg(ax+b) (linear regression) fits the model equation y=ax+b to
the data using a least-squares fit. It displays values for
a (slope) and
b (y-intercept); when DiagnosticOn is set, it also displays values
for
r
2
and r.
LinReg(ax+b) [Xlistname,Ylistname,freqlist,regequ]
QuadReg (quadratic regression) fits the second-degree
polynomial y=ax
2
+bx+c to the data. It displays values for a, b,
and
c; when DiagnosticOn is set, it also displays a value for R
2
.
For three data points, the equation is a polynomial fit; for four
or more, it is a polynomial regression. At least three data points
are required.
QuadReg [Xlistname,Ylistname,freqlist,regequ]
1.Var Stats
2.Var Stats
Med.Med
(ax+b)
LinReg
(ax+b)
QuadReg
(ax2+bx+c)

 Loading...


