Inferential Statistics and Distributions 13–31
8250FC~1.DOC TI-83 international English Bob Fedorisko Revised: 10/26/05 1:39 PM Printed: 10/27/05 2:57
PM Page 31 of 36
tcdf( computes the Student-t distribution probability between
lowerbound and upperbound for the specified df (degrees of
freedom), which must be > 0.
tcdf(lowerbound,upperbound,df)
c
2
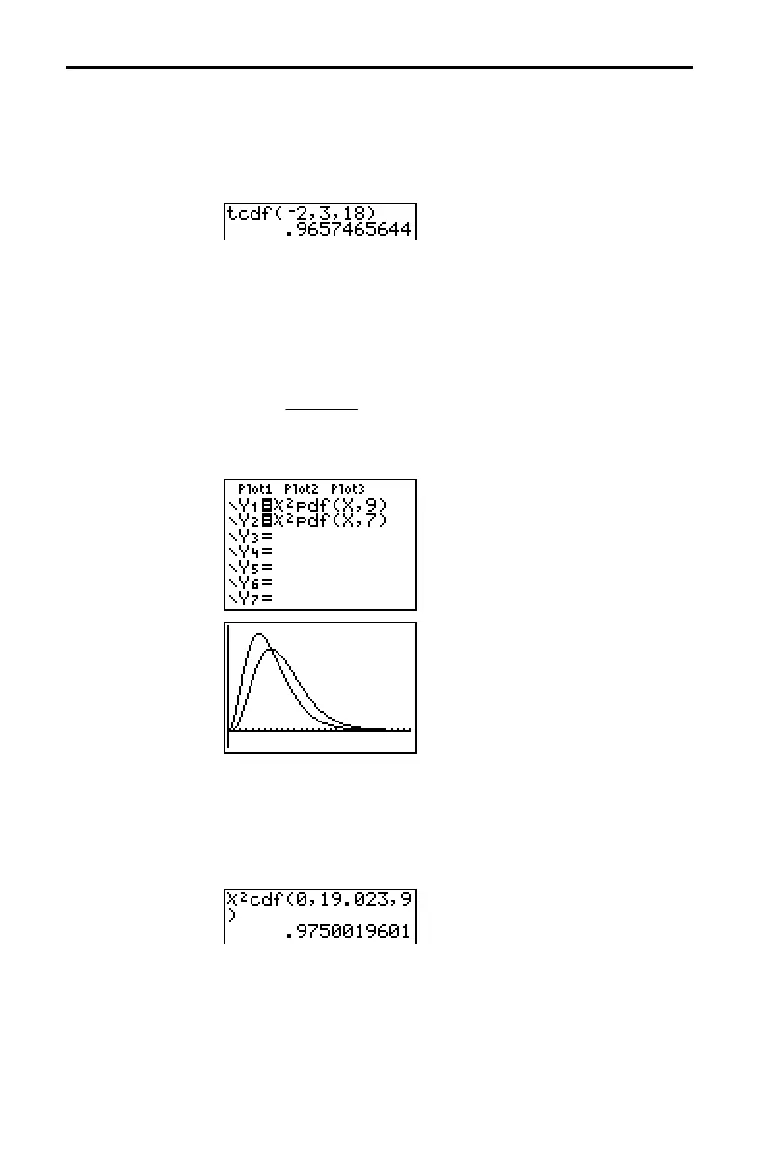
pdf( computes the probability density function (pdf) for the c
2
(chi-square) distribution at a specified x value. df (degrees of
freedom) must be an integer > 0. To plot the c
2
distribution,
paste c
2
pdf( to the Y= editor. The probability density function
(pdf) is:
fx
df
xex
df df x
()
()
(1/2)=≥
−−
1
2
0
221 2
Γ /
,
// /
c
2
pdf(x,df)
Note: For this example,
min = 0
max = 30
min = L.02
max = .132
c
2
cdf( computes the c
2
(chi-square) distribution probability
between lowerbound and upperbound for the specified df
(degrees of freedom), which must be an integer > 0.
c
2
cdf(lowerbound,upperbound,df)
tcdf(
c
2
pdf(
c
2
cdf(

 Loading...


