3.16 Function Graphing
82533F~1.DOC TI-83 international English Bob Fedorisko Revised: 10/26/05 1:20 PM Printed: 10/27/05 1:55
PM Page 16 of 28
82533F~1.DOC TI-83 international English Bob Fedorisko Revised: 10/26/05 1:20 PM Printed: 10/27/05 1:55
PM Page 16 of 28
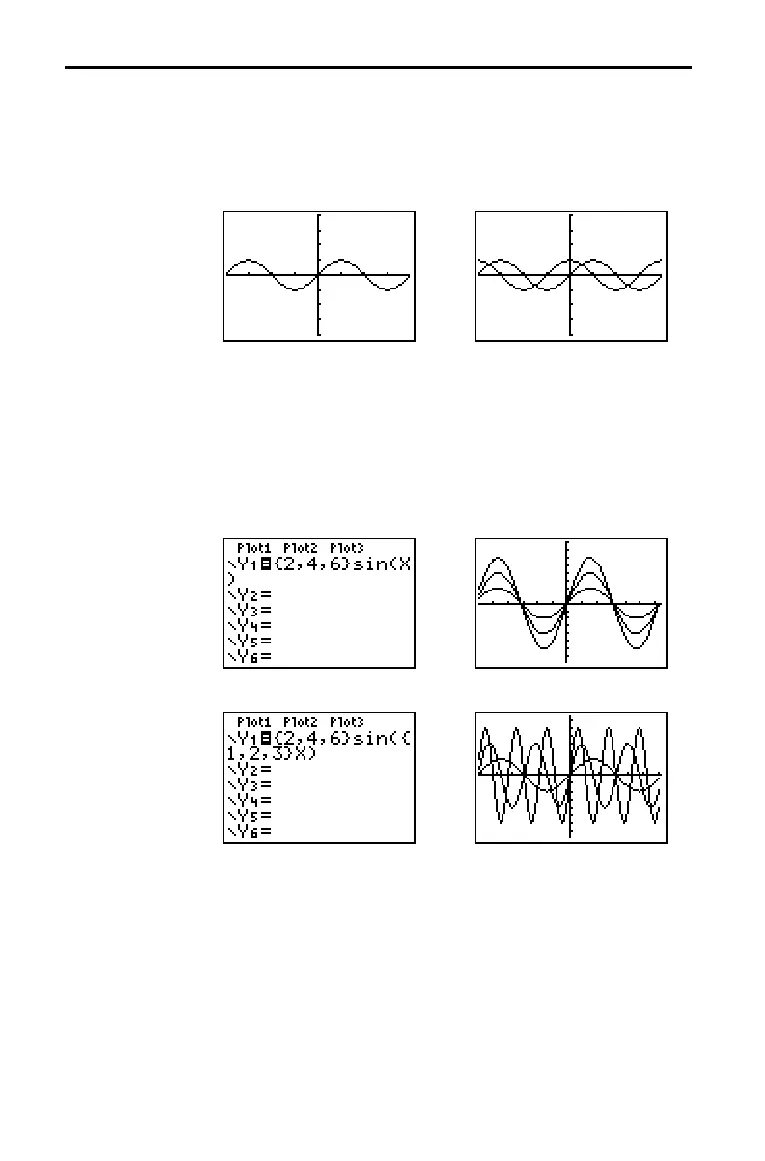
On the TI-82 STATS, you can graph one or more new functions
without replotting existing functions. For example, store
sin(X)
to Y1 in the Y= editor and press s. Then store cos(X) to Y2
and press s again. The function Y2 is graphed on top of Y1,
the original function.
If you enter a list (Chapter 11) as an element in an expression,
the TI-82 STATS plots the function for each value in the list,
thereby graphing a family of curves. In
Simul graphing-order
mode, it graphs all functions sequentially for the first element in
each list, and then for the second, and so on.
{2,4,6}sin(X) graphs three functions: 2 sin(X), 4 sin(X), and
6 sin(X).
{2,4,6}sin({1,2,3}X) graphs 2 sin(X), 4 sin(2X), and 6 sin(3X).
Note: When using more than one list, the lists must have the same
dimensions.
Displaying Graphs (continued)
Overlaying
Functions on a
Graph
Graphing a
Family of Curves

 Loading...


