144 Chapter 9: Sequence Graphing
09SEQUEN.DOC TI-89/TI-92 Plus: Sequence Graphing (English) Susan Gullord Revised: 02/23/01 10:59 AM Printed: 02/23/01 2:14 PM Page 144 of 14
Standard values (set when you select
6:ZoomStd
from the
„
Zoom
toolbar menu) are:
nmin = 1.
xmin =
ë
10. ymin =
ë
10.
nmax = 10. xmax = 10. ymax = 10.
plotStrt = 1. xscl = 1. yscl = 1.
plotStep = 1.
You may need to change the standard values for the
n
and
plot
variables to ensure that sufficient points are plotted.
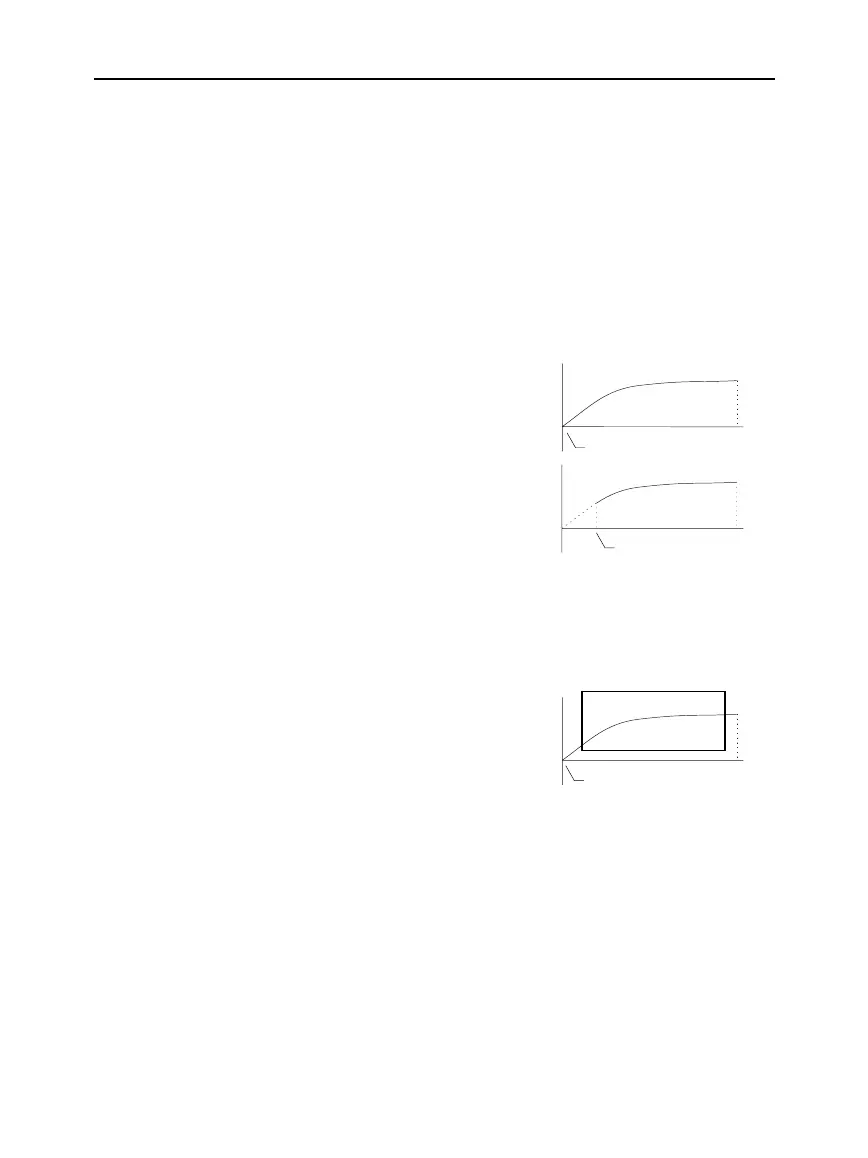
To see how
plotstrt
affects a graph, look at the following examples of
a recursive sequence.
This graph is plotted beginning
with the 1st term.
This graph is plotted beginning
with the 9th term.
With
TIME
axes (from
Axes
on the Y= Editor), you can set
plotstrt = 1
and still graph only a selected part of the sequence. Simply define a
viewing window that shows only the area of the coordinate plane
you want to view.
You could set:
¦
xmin
= first
n
value to graph
¦
xmax
=
nmax
(although you
can use other values)
¦
ymin
and
ymax
= expected
values for the sequence
The
Graph Order
format is not available.
¦ With
TIME
or
CUSTOM
axes, multiple sequences are always
plotted simultaneously.
¦ With
WEB
axes, multiple sequences are always plotted
sequentially.
Window Variables
(Continued)
Note: Both of these graphs
use the same Window
variables, except for plotstrt.
Changing the Graph
Format
plotStrt=1
plotStrt=9
plotStrt=1
nmax

 Loading...


