188 Chapter 11: Differential Equation Graphing
11DIFFEQ.DOC TI-89/TI-92 Plus: Differential Equation (English) Susan Gullord Revised: 02/23/01 11:04 AM Printed: 02/23/01 2:15 PM Page 188 of 26
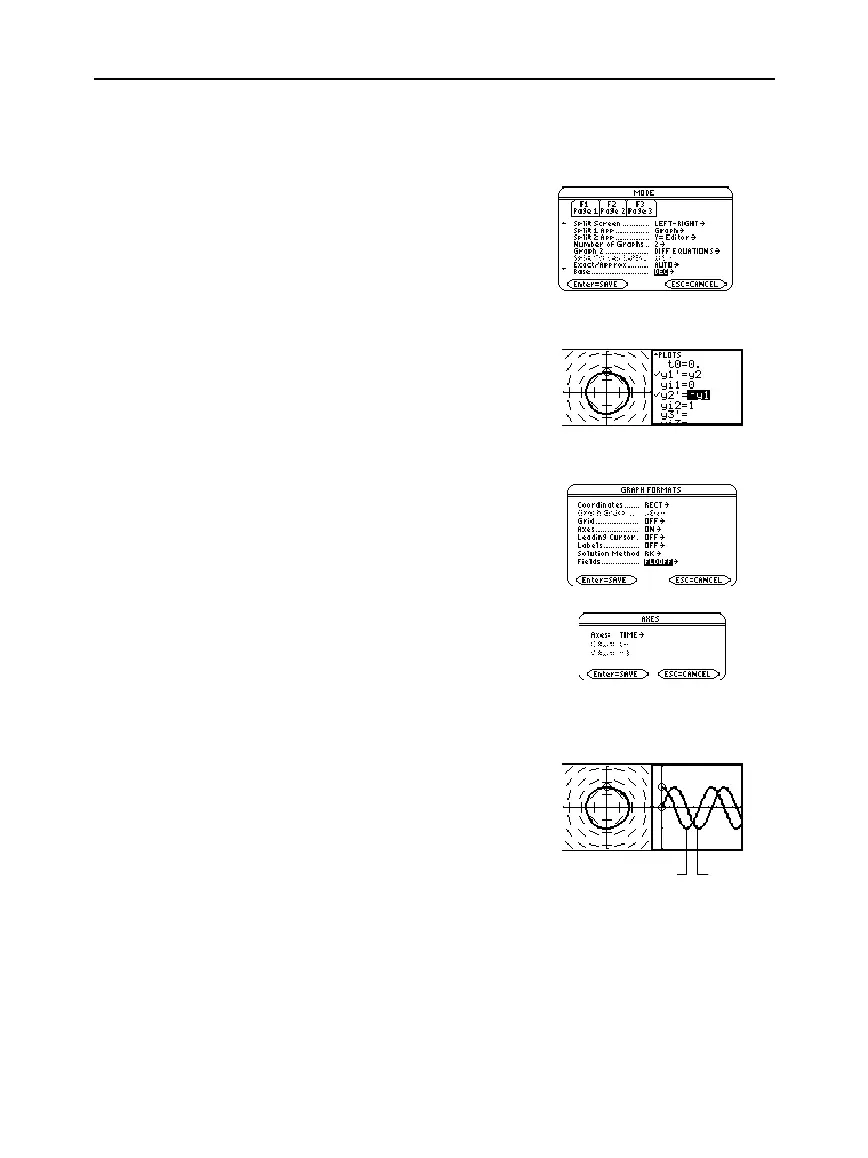
To examine this harmonic oscillator in more detail, use a split screen
to graph the manner in which
y
and
y'
change with respect to time
(t)
.
9. Press
3
and change the
mode settings on Page 2 as
shown. Then close the
MODE
dialog box, which redraws the
graph.
10. Press
2a
to switch to the
right side of the split screen.
11. Use
†
to select
y1'
and
y2'
.
The right side uses the same
equations as the left side.
However, no equations are
selected initially in the right
side.
12. Press:
ƒ
9
—
or
—
TI
-
89:
¥
Í
TI
-
92 Plus:
¥
F
Set
Fields
=
FLDOFF
.
13. In the Y= Editor, press:
TI
-
89
:
2‰
TI
-
92 Plus:
‰
and make sure
Axes = TIME
.
14. In the Window Editor, change
ymin
and
ymax
as shown to the
right.
ymin=
ë
2.
ymax=2.
15. Press
¥%
to display the
Graph screen for graph #2.
The left side shows the phase-
plane orbit. The right side
shows the solution curve and
its derivative.
16. To return to a full screen of
the original graph, press
2a
to switch to the left
side. Then press
3
and
change the
Split Screen
setting.
Split Screen = FULL
Note: To display different
graphs in both parts of a
split screen, you must use
the 2-graph mode.
Important: Because
Fields=
DIRFLD
cannot plot
time axis, you must change
the
Fields
setting.
FLDOFF
turns off all fields.
Note: When you enter 2-
graph mode, Window
variables for the right side
are set to their defaults.
y'
y

 Loading...


