256 Chapter 16: Statistics and Data Plots
16STATS.DOC TI-89/TI-92 Plus: Statistics and Data Plots (English) Susan Gullord Revised: 02/23/01 1:12 PM Printed: 02/23/01 2:17 PM Page 256 of 22
Steps
³
TI
-
89
Keystrokes
›
TI
-
92 Plus
Keystrokes Display
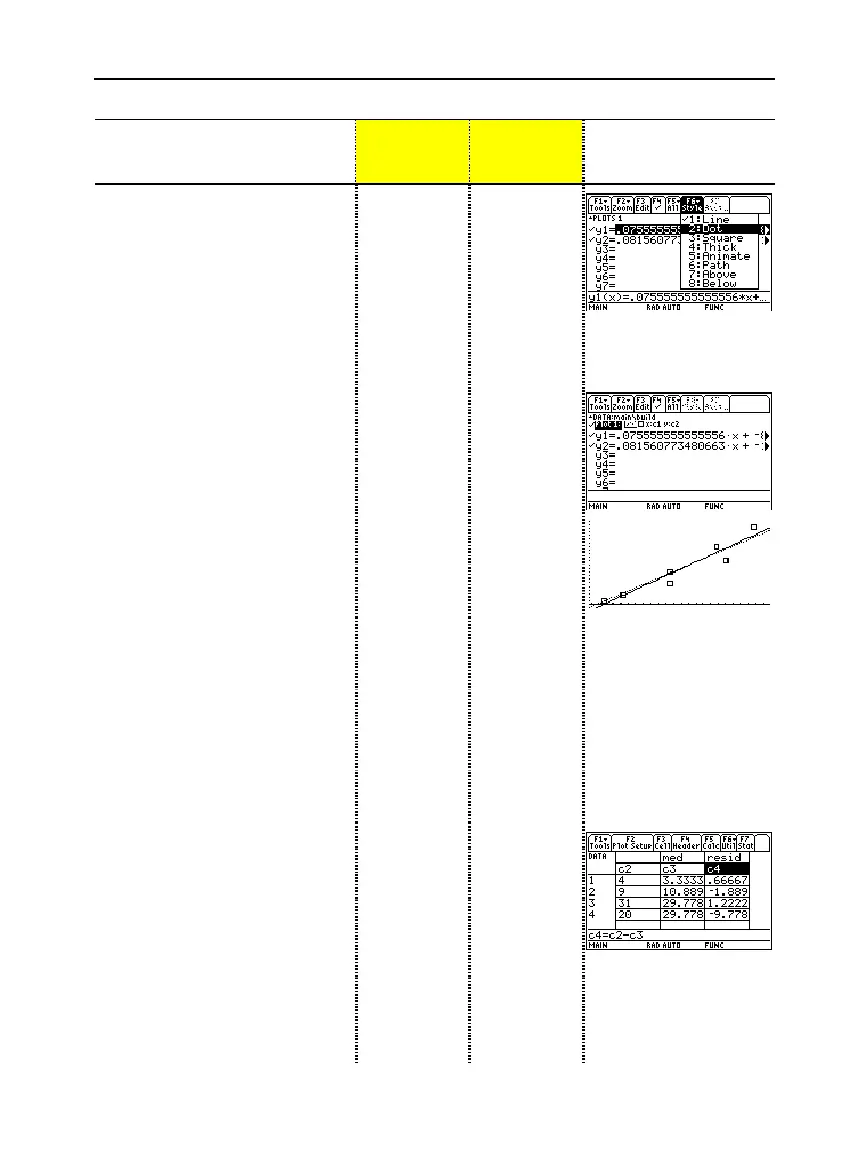
15. Display the Y= Editor. For
y1(x)
,
the MedMed regression
equation, set the display style to
Dot
.
Note:
Depending on the previous
contents of your Y= Editor, you may
need to move the cursor to y1.
PLOTS 1 at the top of the screen
means that Plot 1 is selected.
Notice that y1(x) and y2(x) were
selected when the regression
equations were stored.
¥#
2ˆ
2
¥#
ˆ
2
16. Scroll up to highlight Plot 1.
The displayed shorthand definition is
the same as on the Plot Setup screen.
C
C
17. Use
ZoomData
to graph Plot 1
and the regression equations
y1(x)
and
y2(x)
.
ZoomData examines the data for all
selected stat plots and adjusts the
viewing window to include all points.
„
9
„
9
18. Return to the current session of
the Data/Matrix Editor.
O
61
O
61
19. Enter a title for column 3. Define
column 3’s header as the values
predicted by the MedMed line.
To enter a title, the cursor must
highlight the title cell at the very top of
the column.
†
lets you define a header from
anywhere in a column. When the
cursor is on a header cell, pressing
†
is not required.
BBCC
2™
MED
j¸
†
Y1
cj
C
1
d¸
BBCC
MED
¸
†
Y1
c
C
1
d¸
20. Enter a title for column 4. Define
column 4’s header as the
residuals (difference between
observed and predicted values)
for MedMed.
BC2™
RESID
j
¸
j
C2
|j
C3
¸
BC
RESID
¸
†
C2
|
C3
¸
21. Enter a title for column 5. Define
column 5’s header as the values
predicted by the LinReg line.
BCC2
™
LIN
j
¸
†
Y2
cj
C1
d¸
BC
LIN
¸
†
Y2
c
C1
d¸

 Loading...


