Chapter 16: Statistics and Data Plots 267
16STATS.DOC TI-89/TI-92 Plus: Statistics and Data Plots (English) Susan Gullord Revised: 02/23/01 1:12 PM Printed: 02/23/01 2:17 PM Page 267 of 22
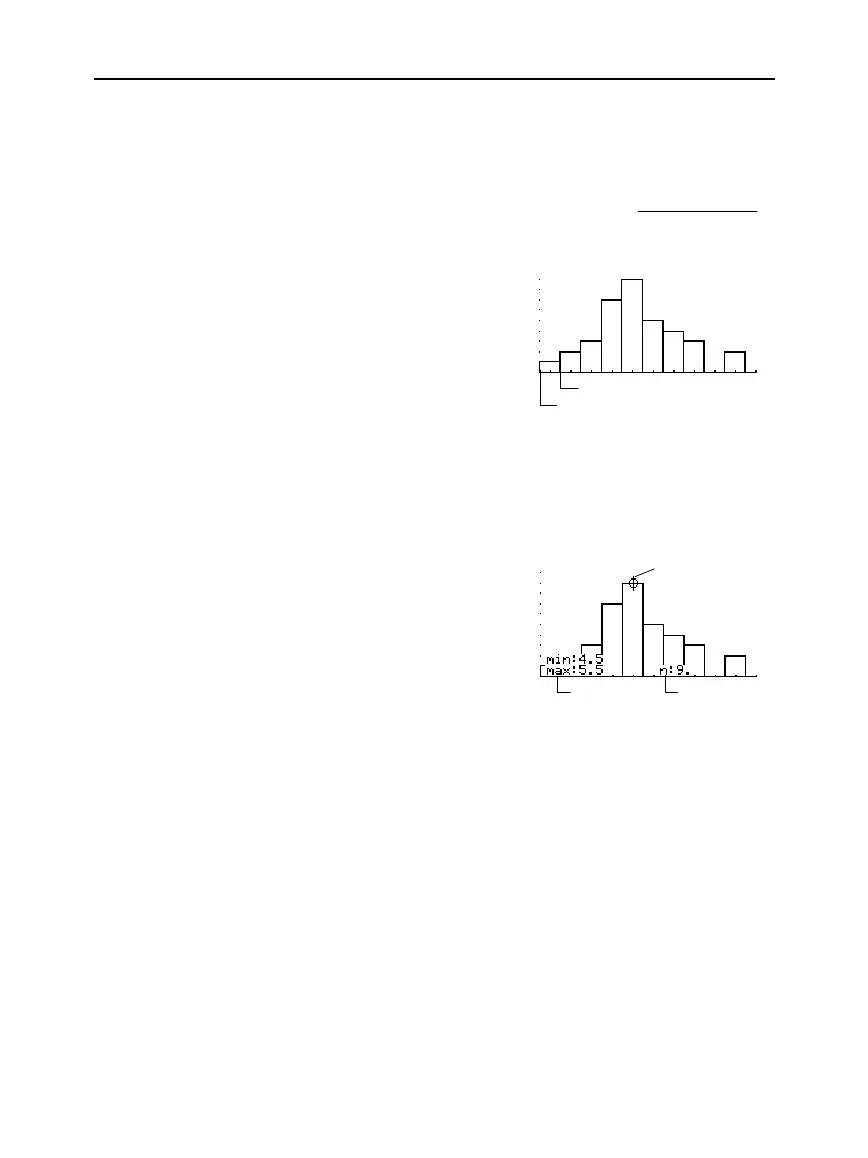
This plots one-variable data as a histogram. The x axis is divided into
equal widths called buckets or bars. The height of each bar (its
y
value) indicates how many data points fall within the bar’s range.
¦
When defining the plot, you
can specify the
Hist. Bucket
Width
(default is 1) to set
the width of each bar.
¦ A data point at the edge of
a bar is counted in the bar
to the right.
¦
ZoomData
(
„
9
from the
Graph screen, Y= Editor, or
Window Editor) adjusts
xmin
and
xmax
to include
all data points, but it does
not adjust the y axis.
− Use
¥$
to set
ymin = 0
and
ymax =
the
number of data points
expected in the tallest
bar.
Number of bars =
xmax
ì
xmin
Hist. Bucket Width
¦ When you trace (
…
) a
histogram, the screen
shows information about
the traced bar.
Histogram
xmin
xmin + Hist. Bucket Width
Range of
the traced
bar
Trace cursor
# of data
points in the
traced bar

 Loading...


