398 Chapter 23: Activities
23ACTS.DOC TI-89/TI-92 Plus: Activities (English) Susan Gullord Revised: 02/23/01 1:24 PM Printed: 02/23/01 2:20 PM Page 398 of 26
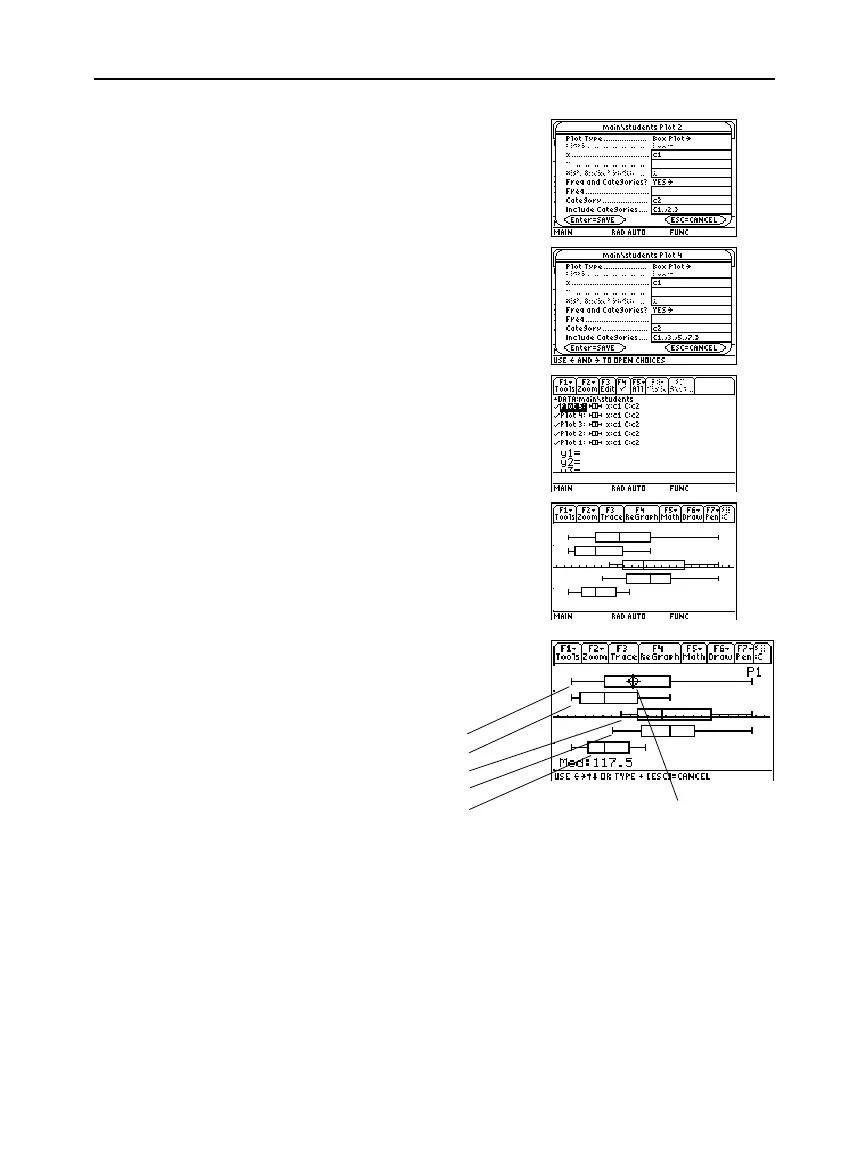
7. Press
ƒ
, and modify the
Include Categories
item for Plot
2 through Plot 5 to the
following:
Plot 2: {1,2}
(freshman boys, girls)
Plot 3: {7,8}
(senior boys, girls)
Plot 4: {1,3,5,7}
(all boys)
Plot 5: {2,4,6,8}
(all girls)
8. In the Y= Editor, deselect any
functions that may be selected
from a previous activity.
9. Display the plots by pressing
„
and selecting
9:Zoomdata
.
10. Use the
Trace
tool to compare
the median student weights for
different subsets.
all students
all freshmen
all seniors
all boys
all girls
median, all students
Note: Only Plot 1 through
Plot 5 should be selected.

 Loading...


