76
4.2.15. Plots Configuration window
To go to the Plots Configuration window, select the Configuration item from the Plots
menu.
With this window (Figure 58), the user configures the settings in the Scatter, Satellites and
Position windows.
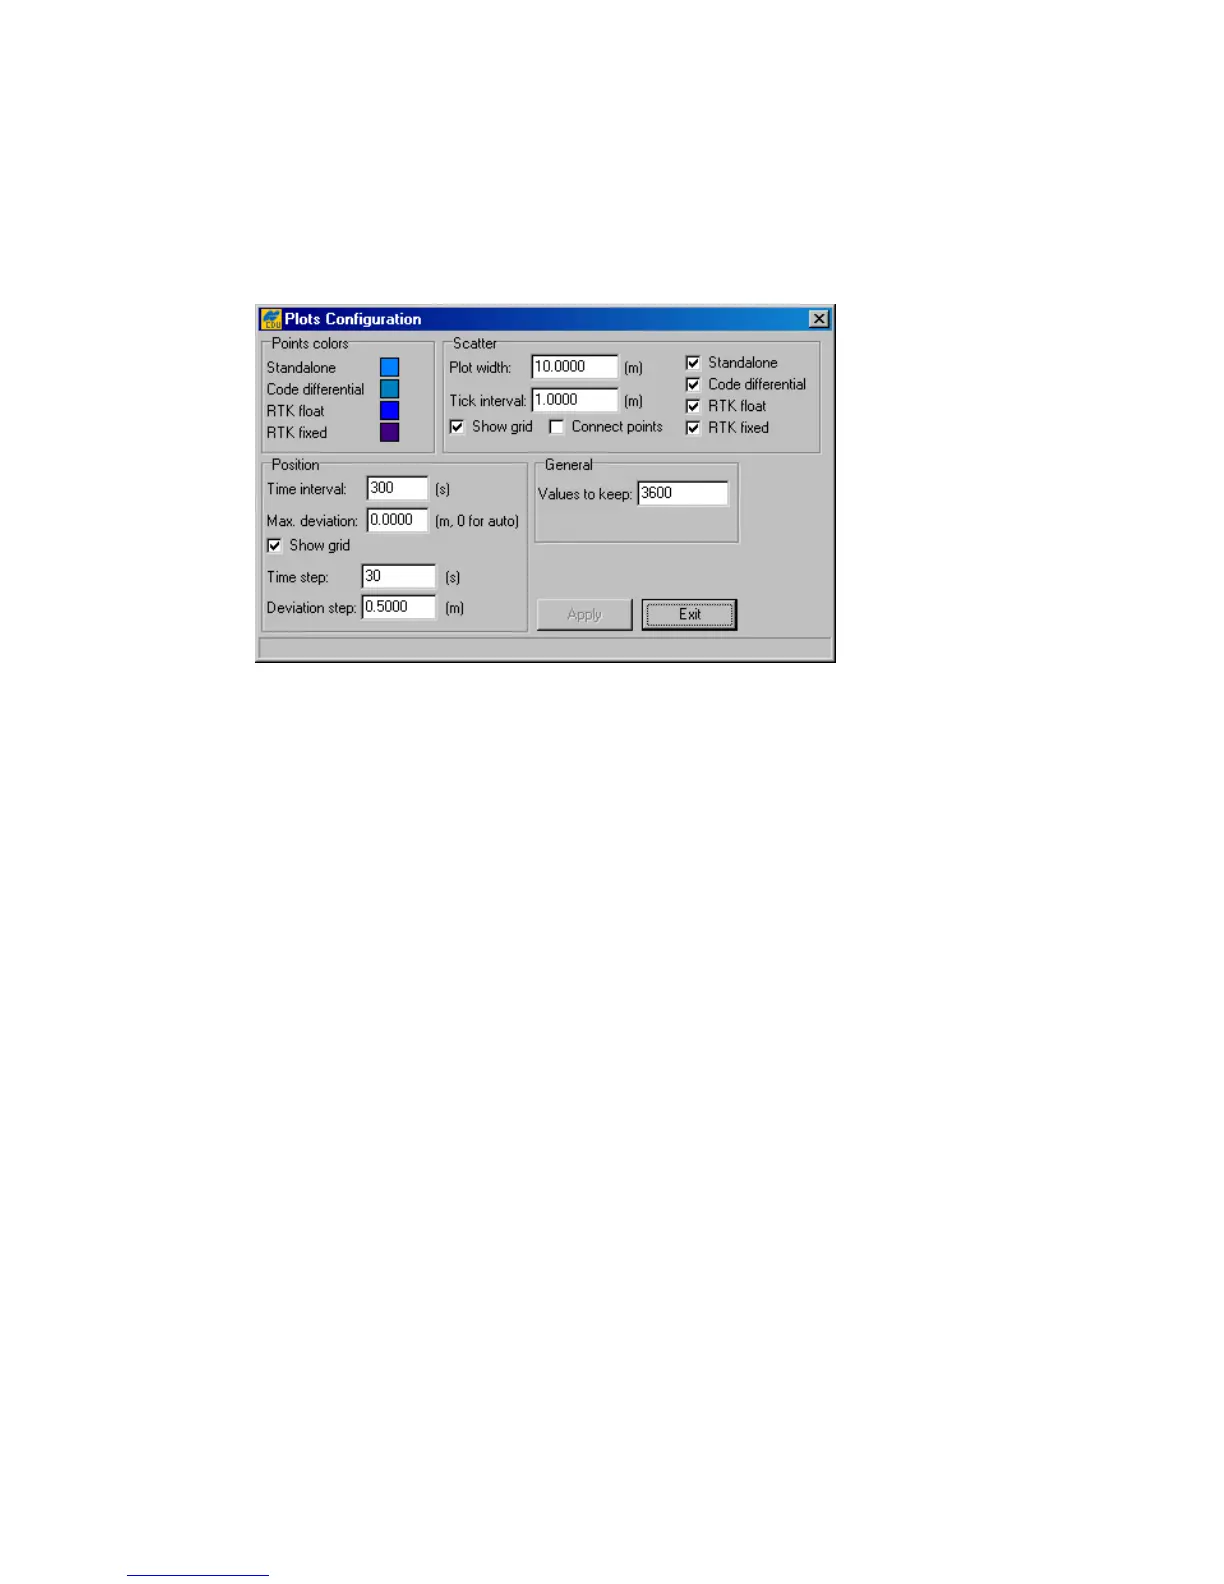
Figure 58. “Plots Configuration” window
To change the color for the points of the Scatter window, use the Points colors settings.
For example, if it is desired that the points corresponding to the absolute position estimates, be
displayed in red, take the following steps:
1. Move the cursor onto the colored box, which is on the right side of Standalone.
2. Click either mouse button in a fill area of the box.
3. Click the color wanted. If the color desired is not seen, click Define Custom
Colors>>. To the right of Basic colors you will see a custom palette where you can
mix your own color. After selecting the color you want, click Add to Custom Colors,
and then click OK.
In the Scatter group box, the user can change the settings related to the Scatter window.
With the Plot Width edit box, the user specifies the length of the axes on the plot.
The Tick Interval edit box specifies the tick size (in meters) between the adjacent concentric
circles (i.e., interval between adjacent values on the axis).
To remove the circle grid from the plot, clear the Show grid checkbox.
To link the points in the trajectory, select the Connect points checkbox.
With the checkboxes Standalone, Code Differential, RTK float and RTK fixed, you
specify what kinds of solutions will be shown on this plot.
The Position group box contains the settings that govern the graphs in the Position window.