XT2640OperatingManual 13July2016 Page57of187
Briefly,thisisperformedby–
1. InsertthedriveintothefrontpanelUSBportandwaitforittobeREADY.
2. Displaythescreentoberecorded.
3. PresstheDRIVEINFOareaofthescreen,thescreenshowsthefileexport/importscreen.
4. PresstheSCREENIMAGEbutton.Thescreenchangestoallowingyoutoenterafilename.
5. Enterthedesiredfilename(theextensionisautomaticallyprovided).
6. Ifthefilealreadyexiststhenyouarepromptedtorespondifyouwishtooverwriteitornot.
7. Thefileisthenwritten.
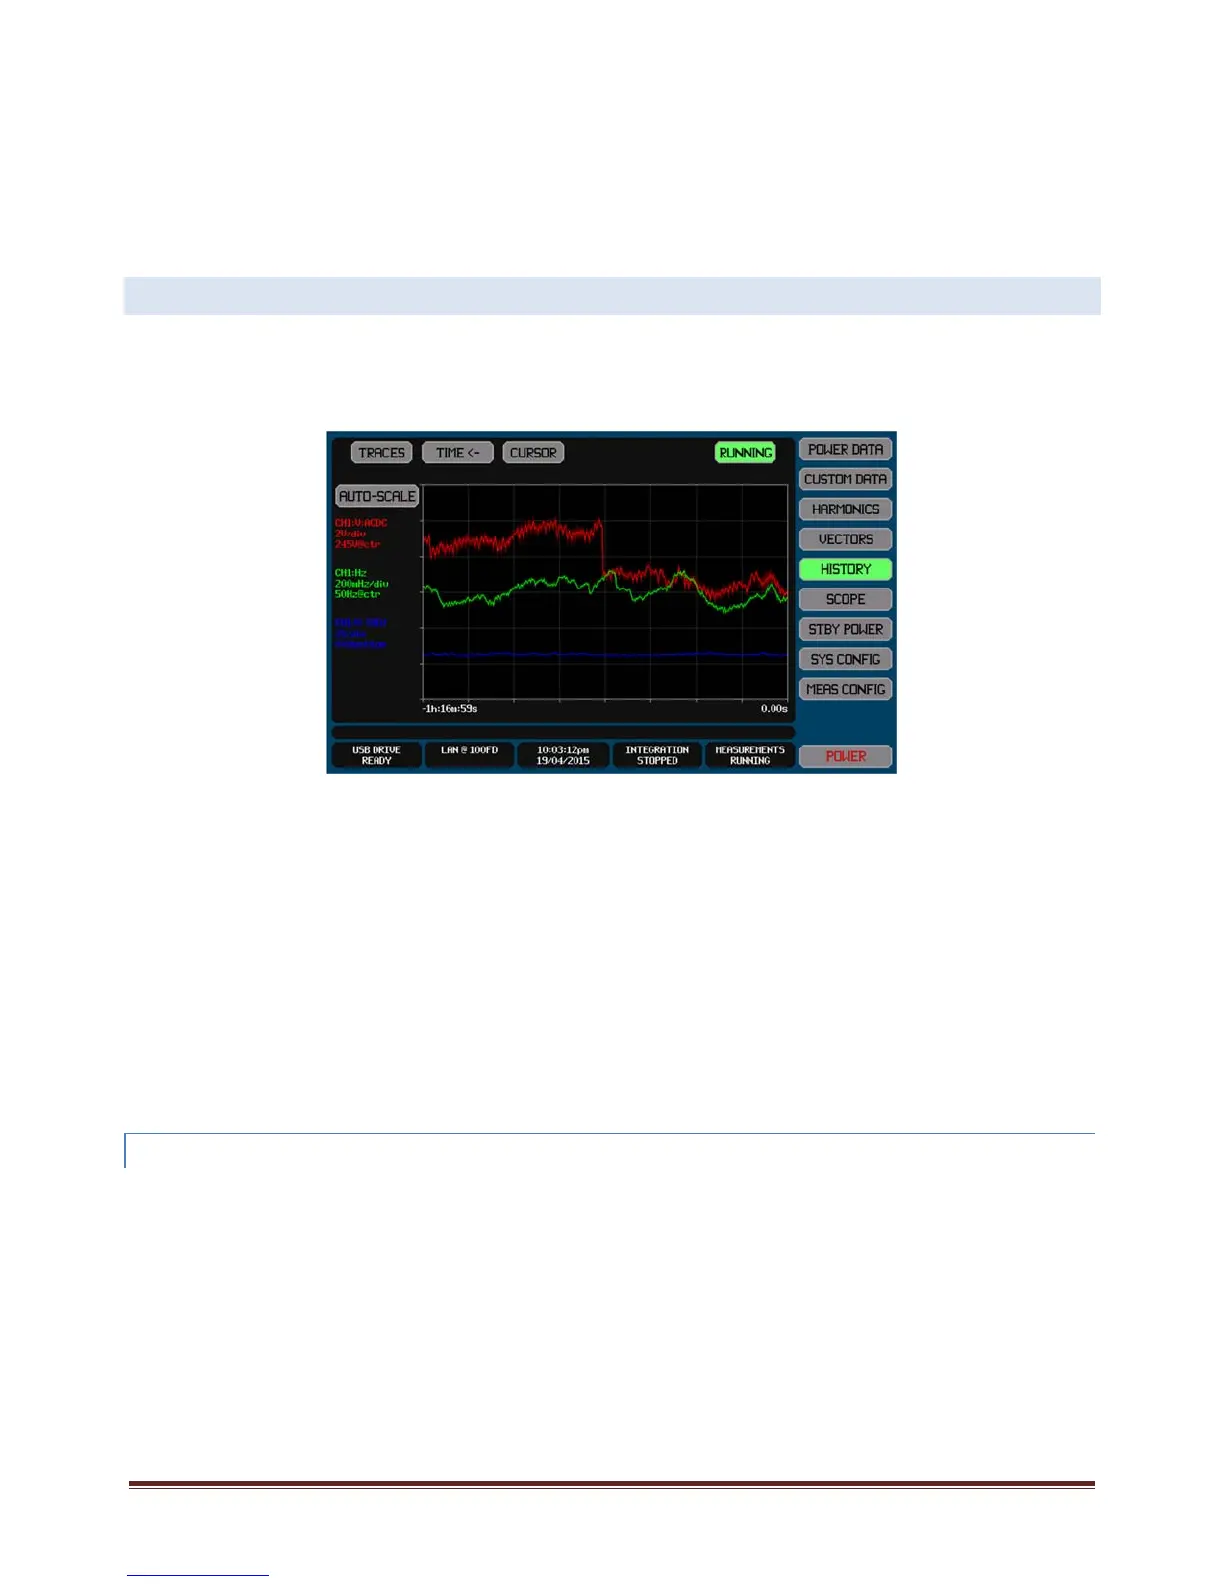
12.9 GRAPHICALLYVIEWINGPAST MEASUREMENTS–THEHISTORYSCREEN
TheHISTORYScreengivesyouaccesstochartsofuptofourmeasuredresultsvselapsedtime.Allavailabledataarealways
recordedwithoutyouhavingtomakeconfigurationsettings.Theonlyconfigurationneededisthatneededtoselectthedatato
displayandtoformatthedisplayofthoseselecteddata,thishasnoeffectontherecordeddata.Youmayselecttodisplaythesame
dataonmorethanonetrace,eachwithdifferentscalingandoffsetasdesired.
TheHISTORYScreencanbeselectedforviewfromanyoftheMainDataScreensbypressingtheHISTORYbutton.
Eachtraceisdrawnshowingtheaverageandtheextentsofthedatawithineachpixel.Theaverageisdrawnwithfullbrightness,
whiletheextentsareshownusingalowerbrightnessbetweenthelowestandhighestextents.Theminimumandmaximum
measurementsfromeveryindividualmeasurementperiodismaintained,andforindividualsamplebaseddatasuchaspeakthis
givesyoucontinuouscoverageofdownto1µsresolutiondataformillionsofyearswithoutdataloss.
Totheleftofthechartthereistextualinformationindicatingthedataselection,color,scalingandoffsetsettingsforeachenabled
traceinabriefformat.
Unlessyouhavezoomedorstoppedthechart,therightendofthechartis‘now’andtheleftendiswhenthechartwasstarted.
Note:
IfnotracesareenabledtobeshownonthechartthenNOTRACESSELECTEDisshowninthechart.
YoudonothavetobeviewingtheHISTORYscreenfordatatobecollected.
YoudonothavetostartRUNNINGunlessyouspecificallystoppedit.
SinceallavailablehistoricaldataarealwayssavedwhileRUNNING,youarefreetochangetracesatwillwithoutneedingto
retakedata,youcanalsoreconfiguremeasurementsatanytime.
Tracesaredrawninnumericalorder,trace1first,andthentrace2,andsoon.Sothehighestnumberedenabledtraceis
theuppermosttraceiftracesoverlap.
12.9.1 SELECTINGANDCONFIGURINGTHETRACESTOSHOW
TheHISTORYscreentracesareselectedandconfiguredbyusingtheTRACESbuttonatthetopofthescreen.Theexamplebelow
showsthescreenwhichisusedtoconfigurethetracestobeshown.