XT2640OperatingManual 13July2016 Page58of187
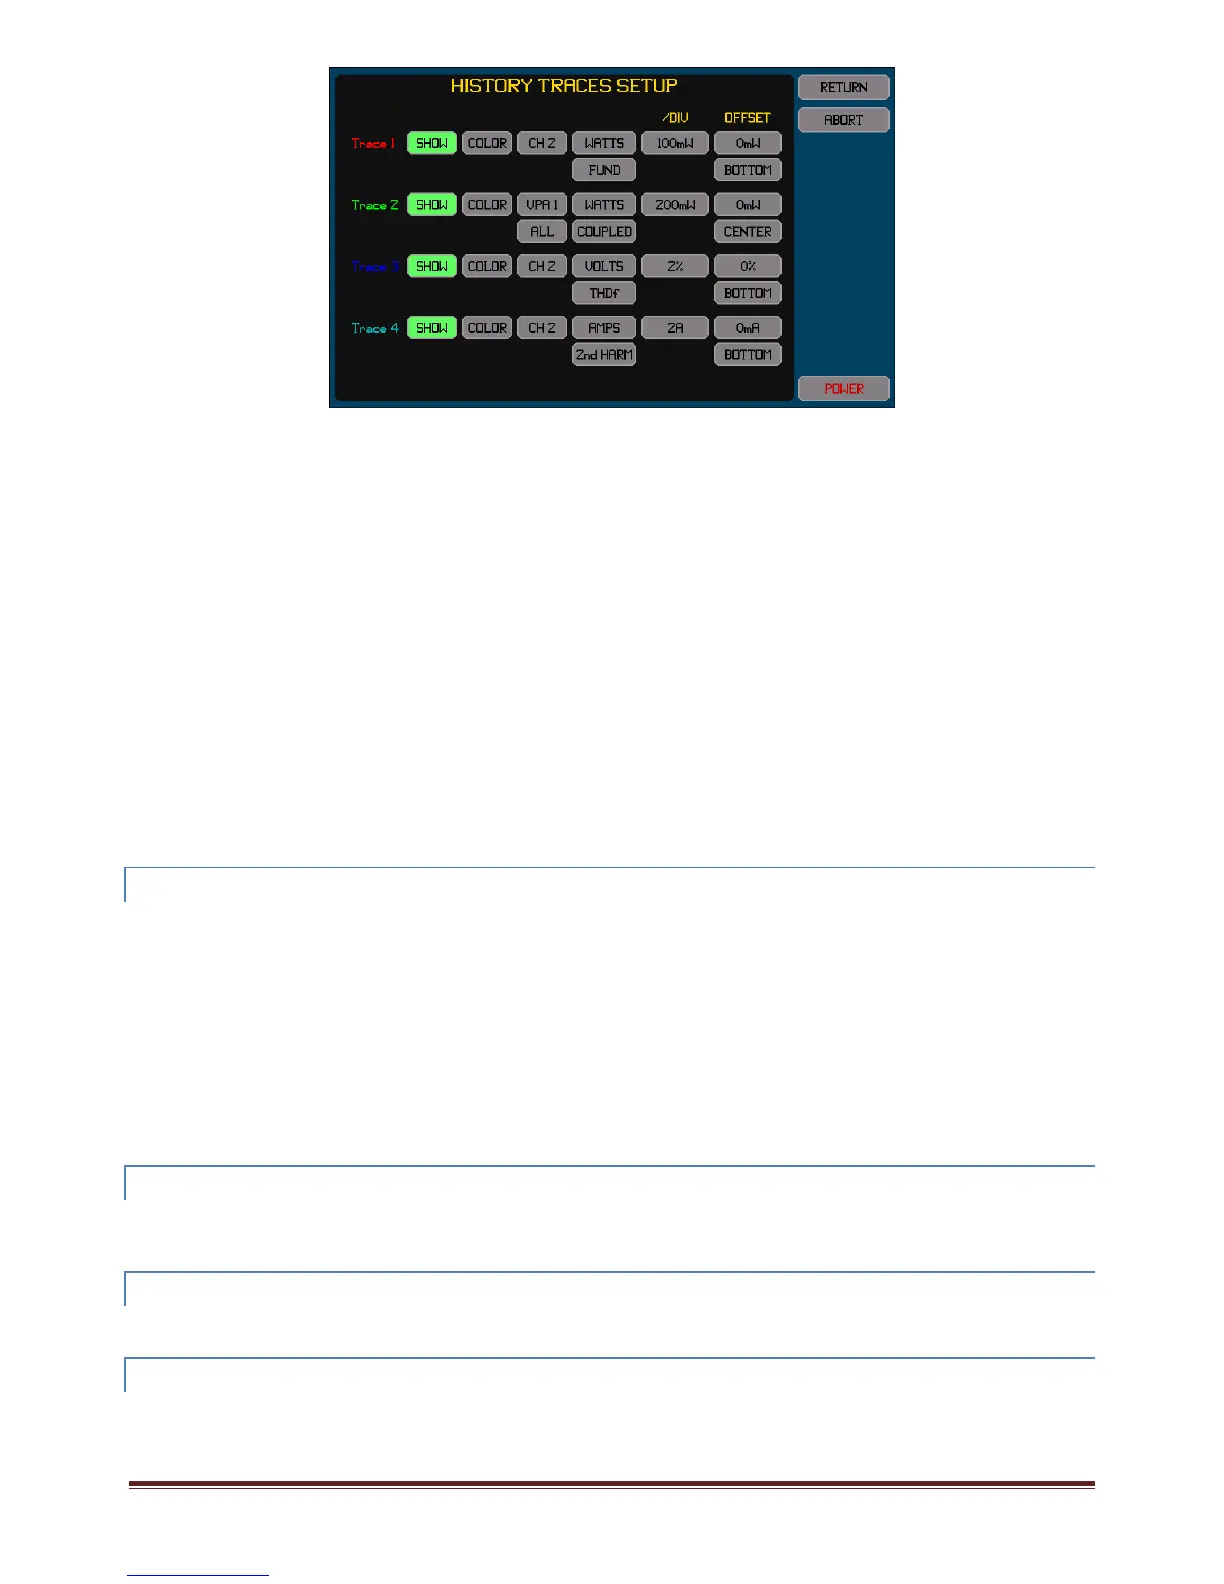
PressingtheSHOWbuttontogglesthetraceon/off.Thebuttonishighlightedcoloredgreenwhenenabled.
ChangethecolorbyrepeatedlypressingtheCOLORbuttonuntiltheadjacenttracenumbershowsthedesiredcolor.
Therearetwo,threeorfourbuttonstotherightoftheCOLORbuttonwhichallowyoutosetthedesiredmeasurementdatatotrace.
Themeasurementdataselectedisthecombinationofthesesettings.
Thebuttoninthe/DIVcolumnallowsyoutosetthescalingintheunitsoftheselectedmeasurementdata.Notethatthisisentered
perdivisionandthereareatotalofsixverticaldivisionsinthechart.Thiscanalsobesettothebest1/2/5valuestoshowalltraces
withintheextentsofthechartwhentheAUTOSCALEbuttonispressedontheHISTORYscreen.
ThebuttonsintheOFFSETcolumnallowsyoutosetthemeasurementdatavalueandtheplaceonthecharttopositionthatvalue.
Forexampleifavoltagetracewassetfora0.5AoffsetvalueandtheoffsetsettoCENTER,thentheresultingtracewillbein
thecenterofthechartverticallywhenithasthe0.5Avalue,ifhigherthan0.5Athenitwillbehigher(byanamountsetby
thescalingrequired)andwillbelowerifbelow0.5A.
Usuallyifyouareplottingdatathatcanbepositiveornegativeanditiswishedtosetthecharttocovertheentirerangeof
possiblevalues,thenyoushouldsetanoffsetof0attheCENTER,andsetthescalingtoensurethetracestayswithinthe3
divisionsoneithersideofthecenter.
Usuallyifyouareplottingdatawhichisalwayspositive(suchasTHDorCFforexample)anditiswishedtosetthechartto
covertheentirerangeofpossiblevalues,thenyoushouldsetanoffsetof0attheBOTTOM,andsetthescalingtoensurethe
tracestayswithinthe6divisionsofthechart.
Usuallyifyouwishtoplotthedeviationofdatafromsomenominalexpectedvaluethenyoushouldsetthatexpected
nominalvalueastheoffsetandsetfortheoffsetCENTERlocation,andsetthescalingasdesiredtomakeanydeviations
easilyvisible.
12.9.2 CHANGINGTHEWAYINWHICHTIMEISDISPLAYEDONTHECHART
TheTIMEbutton(secondfromtheleftacrossthetopofthescreen)allowsyoutoselecthowtimesareshownonthisscreen.
IfTIME<‐isselectedthentimeisshownbelowthehorizontalaxisofthechartwith0attheright(correspondingto‘now’)
andthetimeatwhichthechartwaslaststartedattheleftwithanegativetimeshownwhichindicatesthetimebeforenow.
IfTIME‐>isselectedthentimeisshownbelowthehorizontalaxisofthechartwith0attheleft(correspondingtowhenthe
chartwaslaststarted)and‘now’attherightwithapositivetimeshownwhichindicatesthetimesincethechartwaslast
started.
IfTIMEisselectedthentheactualtimeofdayisshown.
IfTIME/DATEisselectedthentheactualtimeofdayanddateareshown.
Note:
Theinternalclockusedtodetermineallhistorytimesrelativetowhenitwasstartedisnotthesameclockasusedto
determinethedisplayedtimeofdayanddate.Therecanbeuptoafewsecondsperdaydifferencebetweenthese.
12.9.3 STARTING,STOPPING,ANDRESTARTINGTHECHART
Normallythechartisalwayscollectingmeasurementresults.YoumaystopresultcollectionbypressingtheRUNNINGbutton,and
thenmaystartthechartfromthebeginningbypressingitagain(nowlabelledSTOPPED).Whenstarting,allprevioushistoricaldata
iserasedfrommemory.Thisbuttonishighlightedcoloredgreenwhilethechartisrunning.
12.9.4 PROHIBITINGDATACOLLECTIONTEMPORARILY
Whilerunningachartyoucantemporarilydisabledatacollectionbyholdingmeasurements,seesection12.2.6.While
measurementsareheld,thehistoricalrecordstillruns,butthetracesareblankedduringthistime.
12.9.5 USINGTHECURSORANDZOOMINGTHECHART
Averticallydrawncursormaybeplacedontothechartbyyou.Therearetwowaysofachievingthis–
PresstheCURSORbuttonatthetopofthescreen,thisplacesacursoratthelastusedpositionofthecursor,orattheleft
endofthescreenifthecursorhasnotbeenusedbefore.