XT2640OperatingManual 13July2016 Page68of187
poweranalysis.Anexampleofthiswouldbeperformingpoweranalysiswitha0.1secondmeasurementperiodandspectrum
analysiswitha1Hzfrequencyresolution(sohavinga1secondMEASURINGperiod).
ThisisbecausewhenthefrequencyresolutionissettoalowvaluetheMEASURINGperiodforthespectrumanalysisspansseveral
poweranalysismeasurementperiods,soanychangesrequiredduetomeasurementsmadeinpoweranalysiswillinterfereslightly
withthespectrumanalysisbeingperformed.IftheMEASURINGperiodislessthanthatofthepoweranalysismeasurementperiod
thentheserecommendationsdonotneedtobeconsideredtypically.Therearetwopointswhichmayneedtobeconsidered–
RangechangescouldoccurbecauseofpoweranalysismeasurementsifusingDcurrentoptionchannelsandtheyare
configuredwithARANGEsetforAUTO.Ifitispossiblethatarangechangecouldoccurwhileperforminglowfrequency
resolutionspectrumanalysisthenitisrecommendedthattheAUTOARANGEsettingisnotused.
Toensurethatthesamplingfrequencyofthesignalsisnotanexactmultipleofthefundamentaloranyharmonicsofthe
actualsignalsduringpoweranalysis,theactualsamplingfrequencyisslightlymodifiedin‘real‐time’topreventthis.These
slightchangesinthesamplingfrequencyslightlybroadentheeffectivebandwidthofthespectrumanalysisresults.Ifyou
wishtohavethebestperformanceforspectrumanalysiswhenusingalowfrequencyresolutionandalsousingahighratio
betweentheresolutionandmaximumfrequenciesthenitisrecommendedtouseaFIXEDFUNDsettingforpoweranalysis
(oraNOFUNDsetting)whichpreventsthisfromoccurring.
12.13.3 HOLDINGMEASUREMENTSWHILEPERFORMINGSPECTRUM ANALYSIS
Measurementscanbeheldandreleasedasdescribedinsection12.2.6.
IfameasurementholdisimposedduringtheMEASURINGphaseofspectrumanalysisthenthemeasurementbeingcollectedis
abandonedandthedisplayedspectrumremainsatthatlastshown.
IfameasurementholdisimposedduringthePROCESSINGphaseofspectrumanalysisthentheprocessingcontinuesandtheresults
ofthisprocessingwillsubsequentlybedisplayedwhenthisphasecompletes,butanyfurthermeasurementswillnotbeperformed
untilthemeasurementholdisreleased.
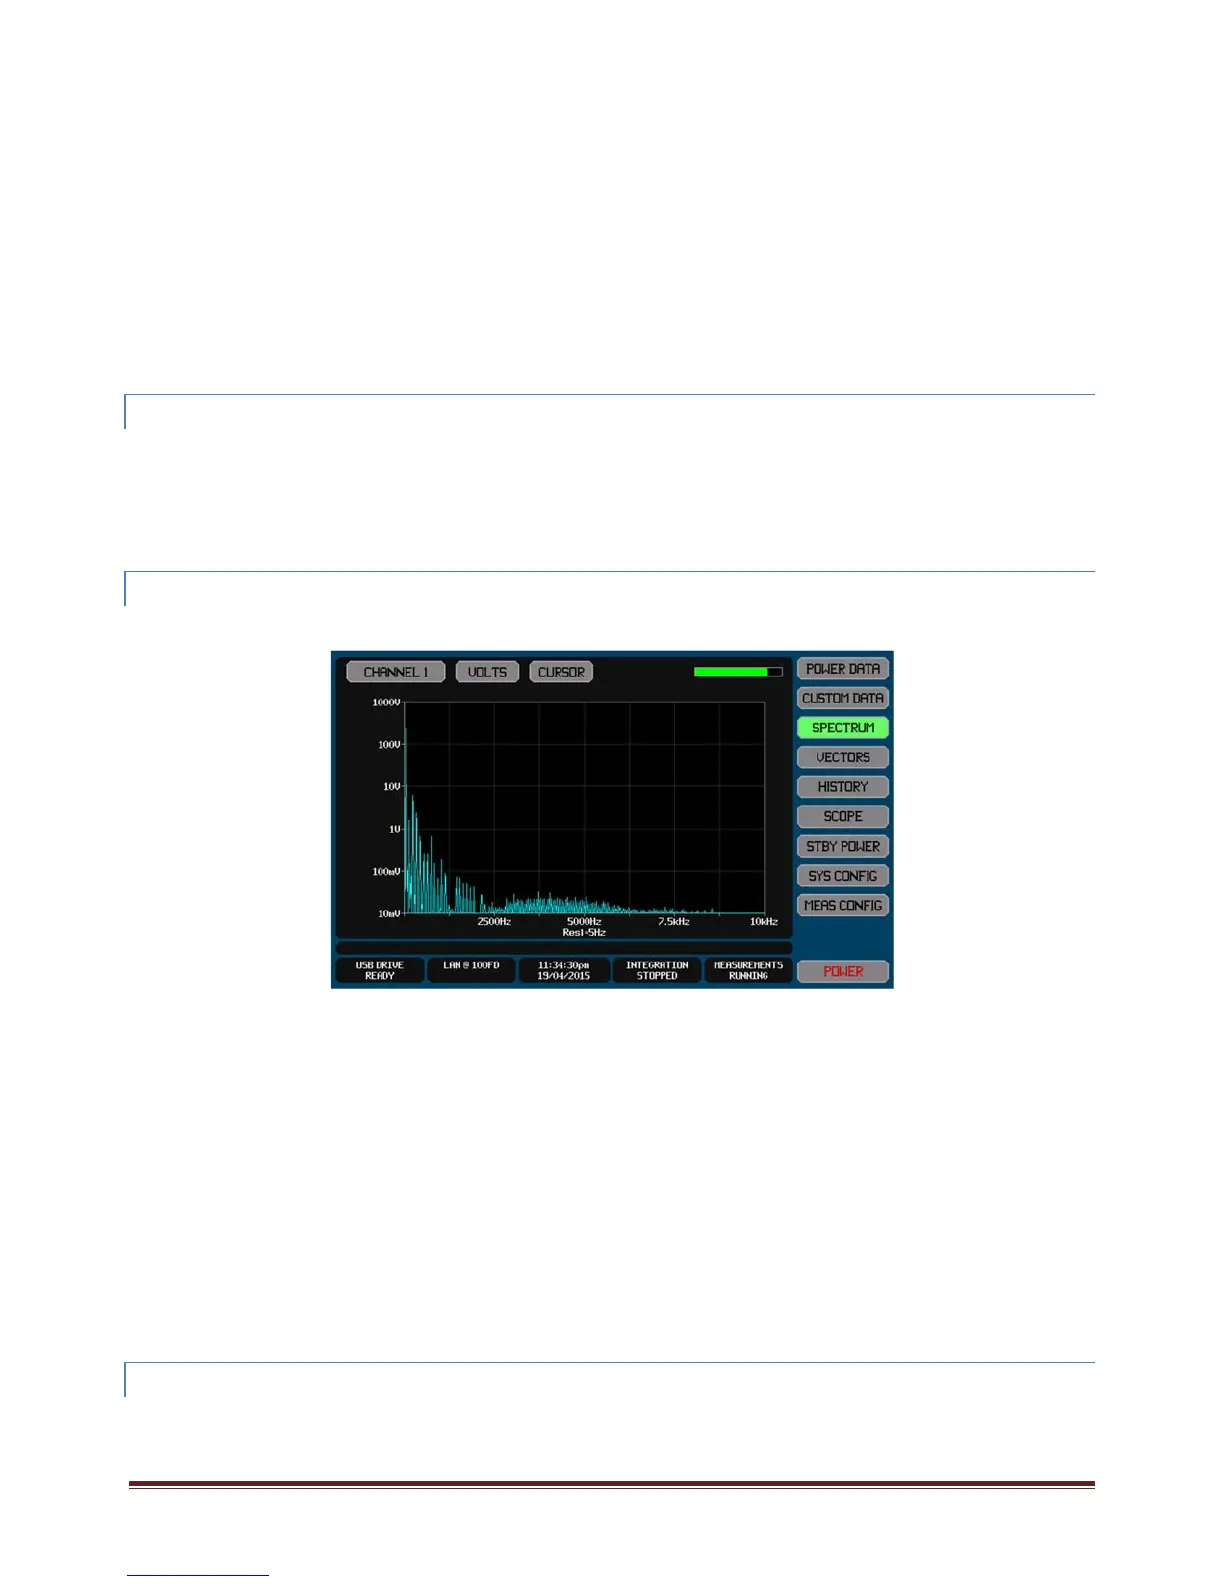
12.13.4 VIEWINGSPECTRUMANALYSISRESULTS
WhenoperatinginSPECTRUMmode,theHARMONICSscreenbuttonshownontherightsideofmostscreensisreplacedbya
SPECTRUMbutton.PressingthisbuttonenablestheresultsofthespectrumanalysistobeviewedontheSPECTRUMscreen.
Ifthespectrumtakesmorethannominally½secondtoperformeitherphaseoftheanalysisthenastatusbarisdisplayed(asshown
ontheexamplescreenabove)whichindicatesthepercentagecompletionoftheMEASURINGphaseandthePROCESSINGphaseas
appropriate.
TheCHANNELbuttonallowsyoutoselectwhichchannelyouareviewingthespectrumof.
TheVOLTS/AMPS/WATTSbuttonallowsyoutoselectwhichsignalintheselectedchannelyouareviewingthespectrumof.
TheCURSORbuttonallowsyoutoturnon/offamoveablecursorwhichallowsyoutoobtainanumericalreadingofthespectrum
contentataspecificfrequency.Ifshown,thecursormaybemovedonepixeltotheleftorrightbyusingthe<‐and‐>buttons,oryou
maydragthecursoronthescreenbypressingwithinthechartarea.
Note:
Thesettingsonthisscreenonlyaffectwhichspectrumisdisplayed;allspectraareobtainedindependentlyofthesettings
onthisscreen.
Whenacursorisshown,theXT2640automaticallydetectsthehighestsignalcontentwithintherangeoffrequencies
coveredbythesinglepixelatwhichthecursorispositioned,displayingthefrequencyandamplitudeofthatmaximum
signal.Ifnomeasuredfrequencyfallswithinthecursorpositionpixelthenitfindsthelargestspectralcontentatthe
adjacentfrequencieswhichhavebeenmeasured.
WhendisplayingaWATTSspectrum,thechartshowsaplotoftheabsolutevalueofwattsateachfrequencypoint.
12.13.5 EXPORTING ORRECORDINGSPECTRUM DATA
Themethodsforperformingthisarefullydescribedinsection23.
TheSPECTRUMdatacanbeexportedtoa.CSVformattextualfileonanexternalUSBdriveattachedtothefrontpanelUSBport.This
filecontainsatabulationofallfrequencypointsforallchannels.