2-4 IM 765501-01E
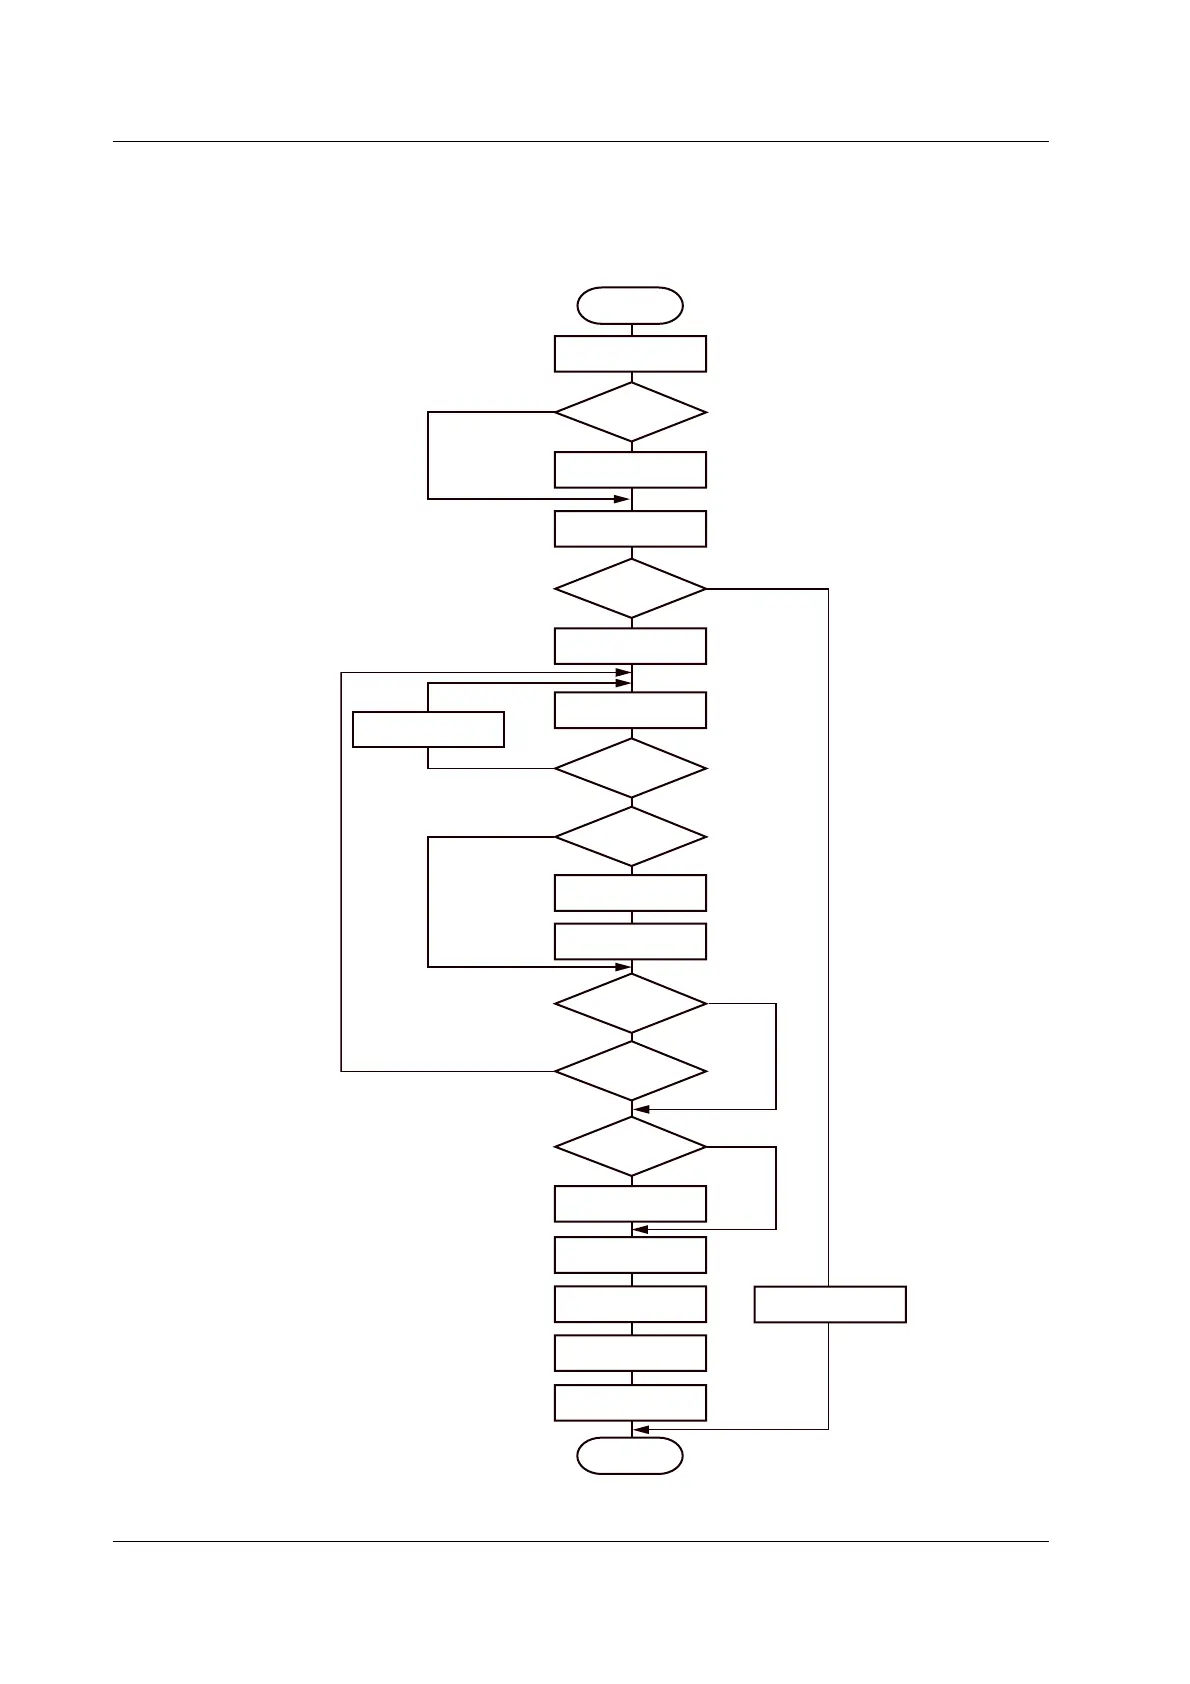
Flow Chart of a Source Measure Cycle
The time indicated in the chart is a typical time needed for its processing. The averaging
time varies depending on the average count, and the computation time varies depending
on the complexity of the equation.
Trigg er
Source delay
+S. Delay
Range
mismatched when auto
source range is
selected?
Range
mismatched when auto
measurement range
is selected?
Change source range
+3 ms
Is measurement ON?
Measurement delay
+M. Delay
A/D operation
+IntgTime*
A/D operation
+IntgTime*
Change to optimal range
+2 ms
Auto zero?
Zero compensation
Block average
operation?
Average count
finished?
Resistance
measurement?
Calculate resistance
+100 µs
Moving average (+moving
average count × 1.5 µs)
Computation
+150 µs
Computation
+150 µs
NULL computation
+20 µs
Comparison
+20 µs
End source
measure cycle
Update source level
+10 µs
No
Yes
No
No
No
No
No
Yes
Yes
No
Yes
Yes
Yes
Yes
* Integration time + 200 µs when the integration time is 250 µs, 1 ms, or 4 ms.
Integration time + 520 µs when the integration time is 20 ms, 100 ms, or 200 ms.
2.2 Source Measure Cycle
 Loading...