188
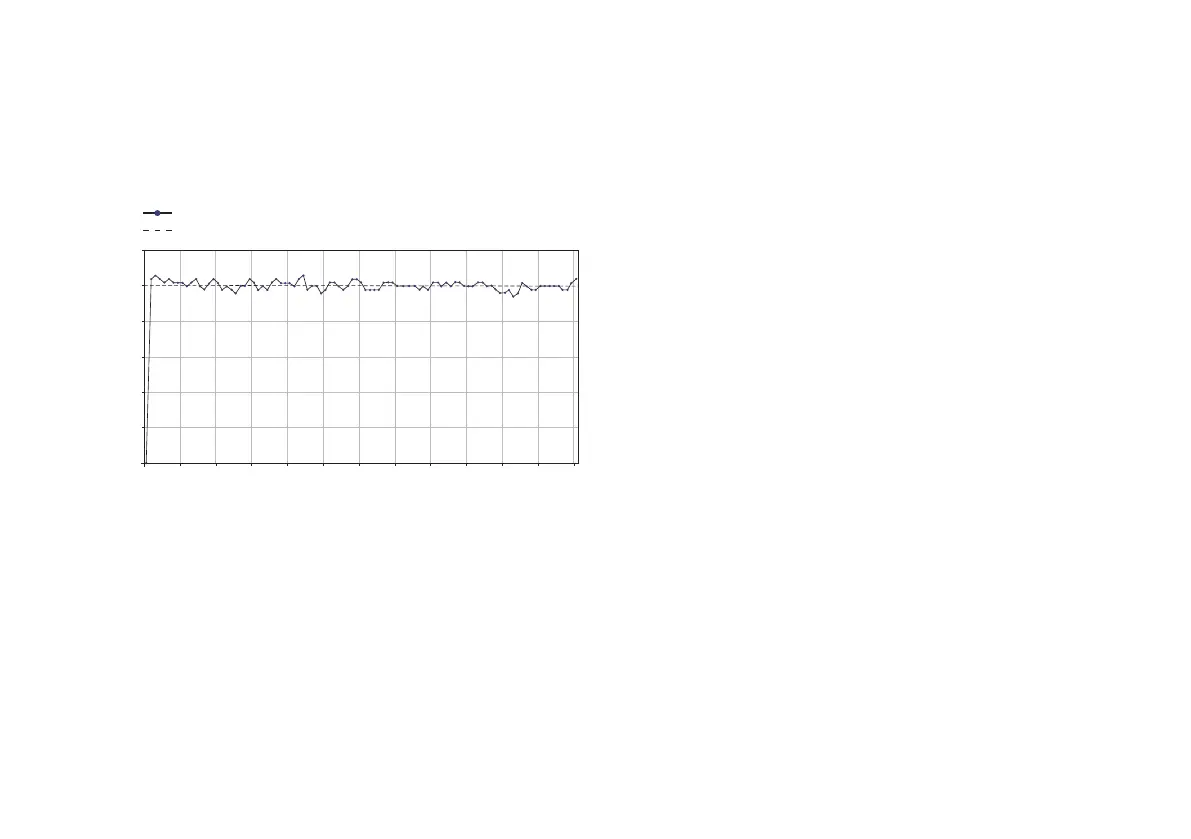
Start-up graph over the stabilization period
The start-up graph shows changes in the ow rate over the
stabilization time.
ow rate (ml / h)
0.012
0.006
0.004
0.002
0.000
0 120 240 360 600 1080 1200 1440480 720 840 960 1320
0.010
0.008
time (min)
real ow
target ow
0.01 ml is equivalent
to 1U (U100 insulin)
Bolus
For U100 insulin the maximum deviation of a maximum bolus is
≤ ± 5 % and the maximum deviation of a minimum bolus is
≤ ± 30 %*.
* The measurements were made according to IEC 60601-2-24:1998 with a
Accu-Chek Tender infusion set PC 17 / 110 at room temperature.
 Loading...