GB 03344 - Edition 04 - March 12
1/8
C 300
Graphic display
Purpose
4
2
3
5
6
1
7
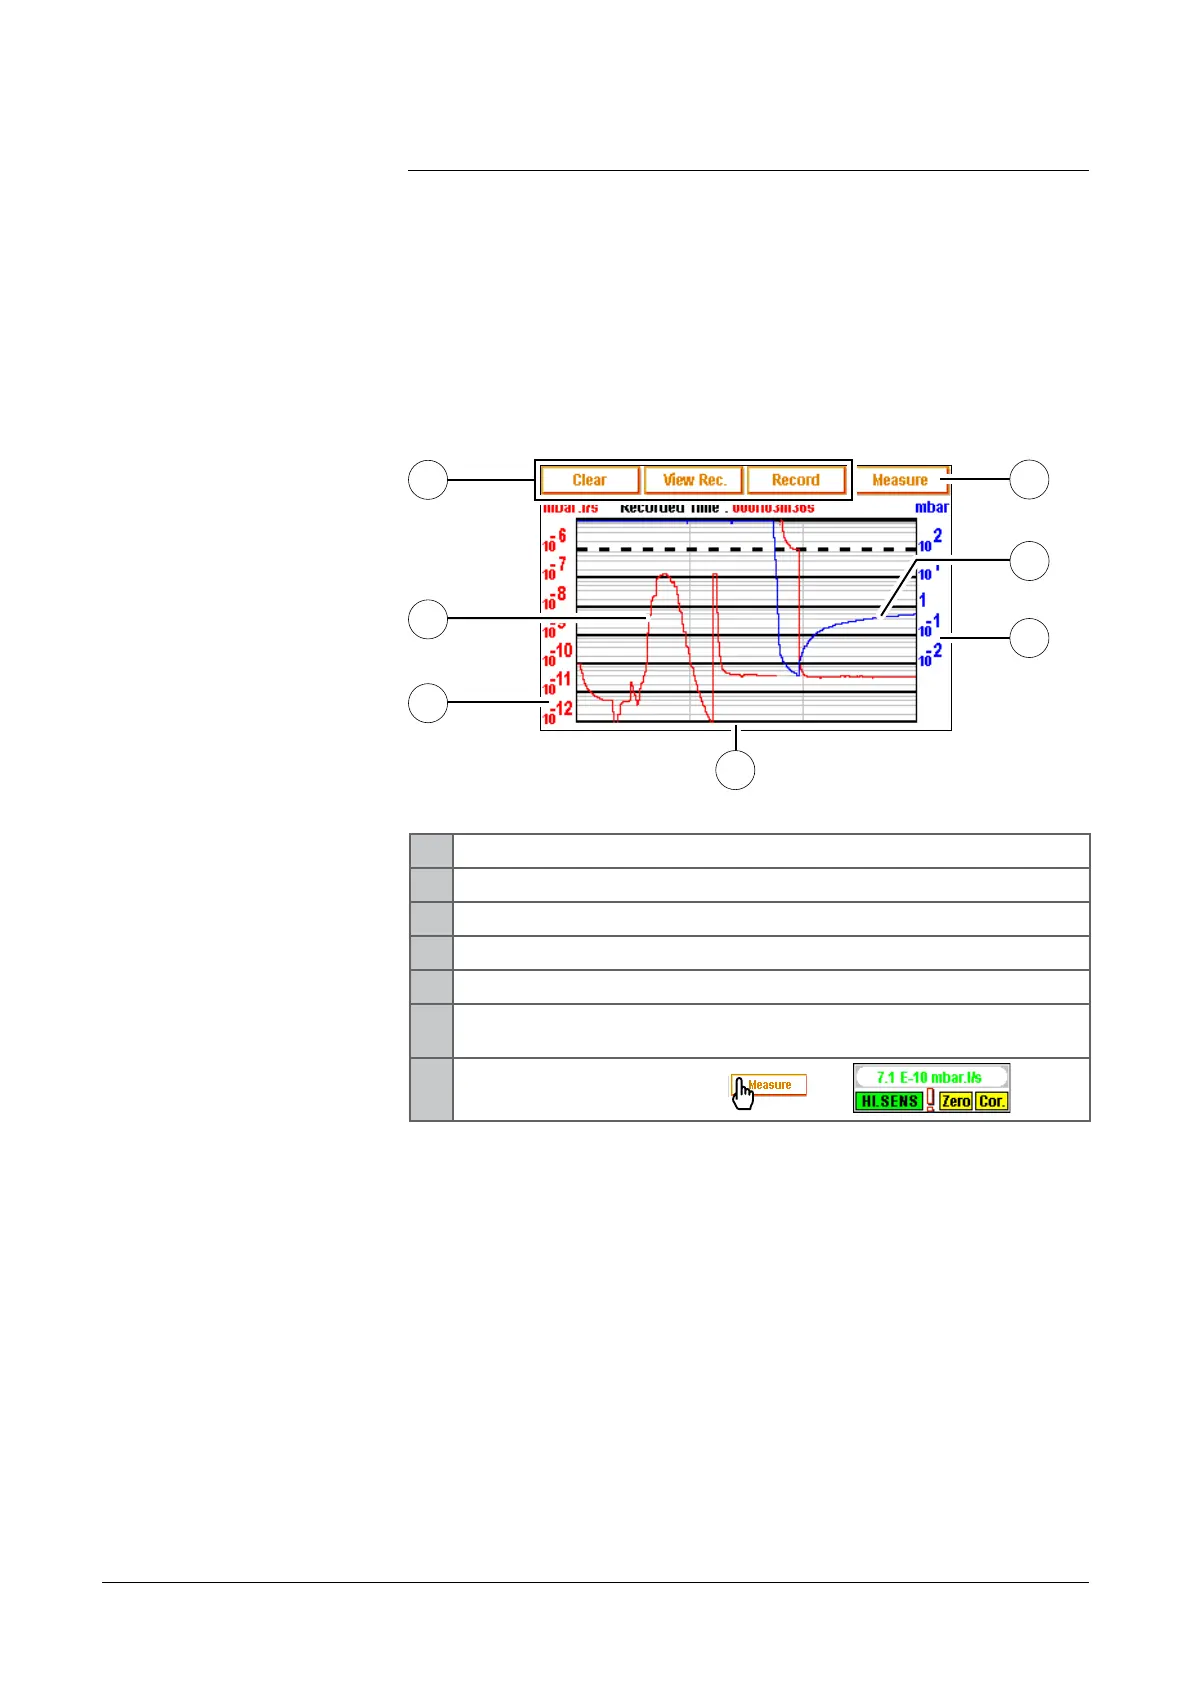
Graphic display allows to the operator to follow the measured signal
and/or inlet pressure evolution in the time and to record it.
1 Delete/visualize/record a plotting
2 Tracer gas signal display (in red)
3 Tracer gas signal scale (in red)
4 Time scale
5 Inlet pressure scale (in blue)
6
Inlet pressure display (in blue): pressure =10
3
constantly if
there is no external gauge connected
7
Measure displayed/hidden:
—>
Scales (3), (4), (5), are adjustable by pressing on the graph.
The operator could move the "measure" window on the touch-
sensitive screen: press on the measure window with the finger
and move this one on the screen.
adixen Vacuum Products - ASM 310 Operating instructions