120 Agilent 1260 Infinity DAD and MWD User Manual
6 How to optimize the Detector
Optimizing for Sensitivity, Selectivity, Linearity and Dispersion
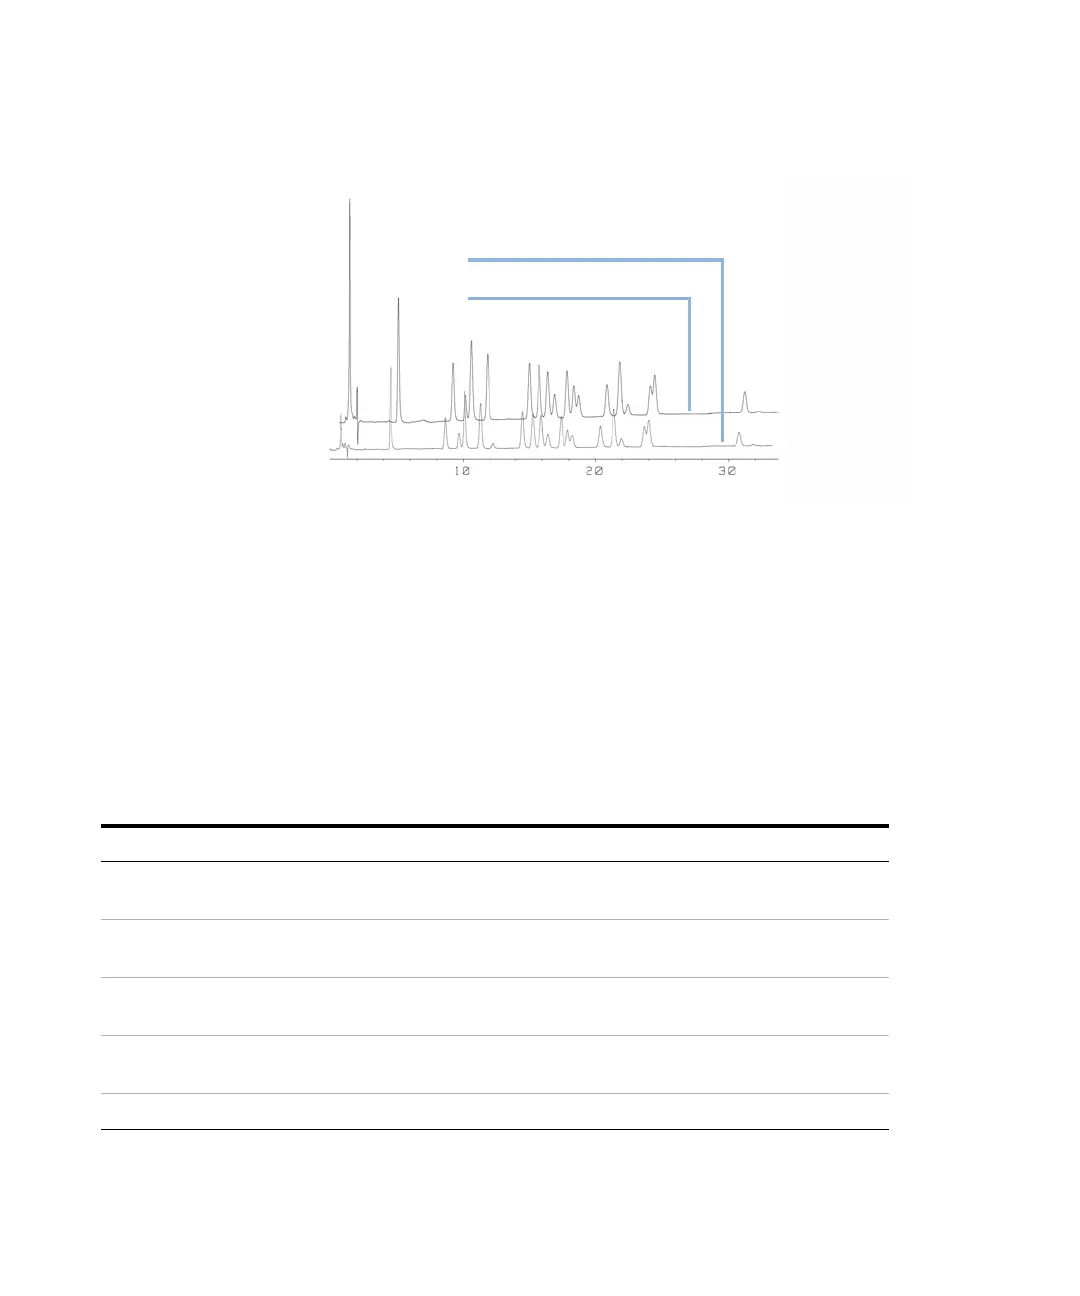
Figure 51 Influence of Cell Path Length on Signal Height
Traditionally LC analysis with UV detectors is based on comparing
measurements with internal or external standards. To check photometric
accuracy of the detector it is necessary to have more precise information on
path lengths of the flow cells.
The correct response is:
expected response * correction factor
Please find below the details of the flow cells:
6WhdgWVcXZ
I^bZb^c
6cVanh^hd[eZhi^X^YZhiVcYVgY
&%"bbdei^XVaeVi]aZc\i]
+"bbdei^XVaeVi]aZc\i]
Tab le 28 Correction factors for flow cells
Flow cell Path length (actual) Correction factor
Standard flow cell, 10 mm, 13 µL, 120 bar (12 MPa) (p/n
G1315-60022)
9.80 ±0.07 mm 10/9.8
Semi-micro flow cell, 6 mm, 5 µL, 120 bar (12 MPa) (p/n
G1315-60025)
5.80 ±0.07 mm 6/5.8
Micro flow cell, 3 mm, 2 µL, 120 bar (12 MPa) (p/n
G1315-60024)
3.00 +0.05 mm/-0.07
mm
3/3
Semi-nano flow cell kit, 10 mm, 500 nL, 5 MPa (p/n
G1315-68724)
10.00 ±0.02 mm 10/10
Nano flow cell kit, 10 mm, 80 nL, 5 MPa (p/n G1315-68716) 6.00 ±0.02 mm 6/6
 Loading...