Agilent 1260 Infinity DAD and MWD User Manual 119
How to optimize the Detector
6
Optimizing for Sensitivity, Selectivity, Linearity and Dispersion
Optimizing for Sensitivity, Selectivity, Linearity and Dispersion
Flow Cell Path Length
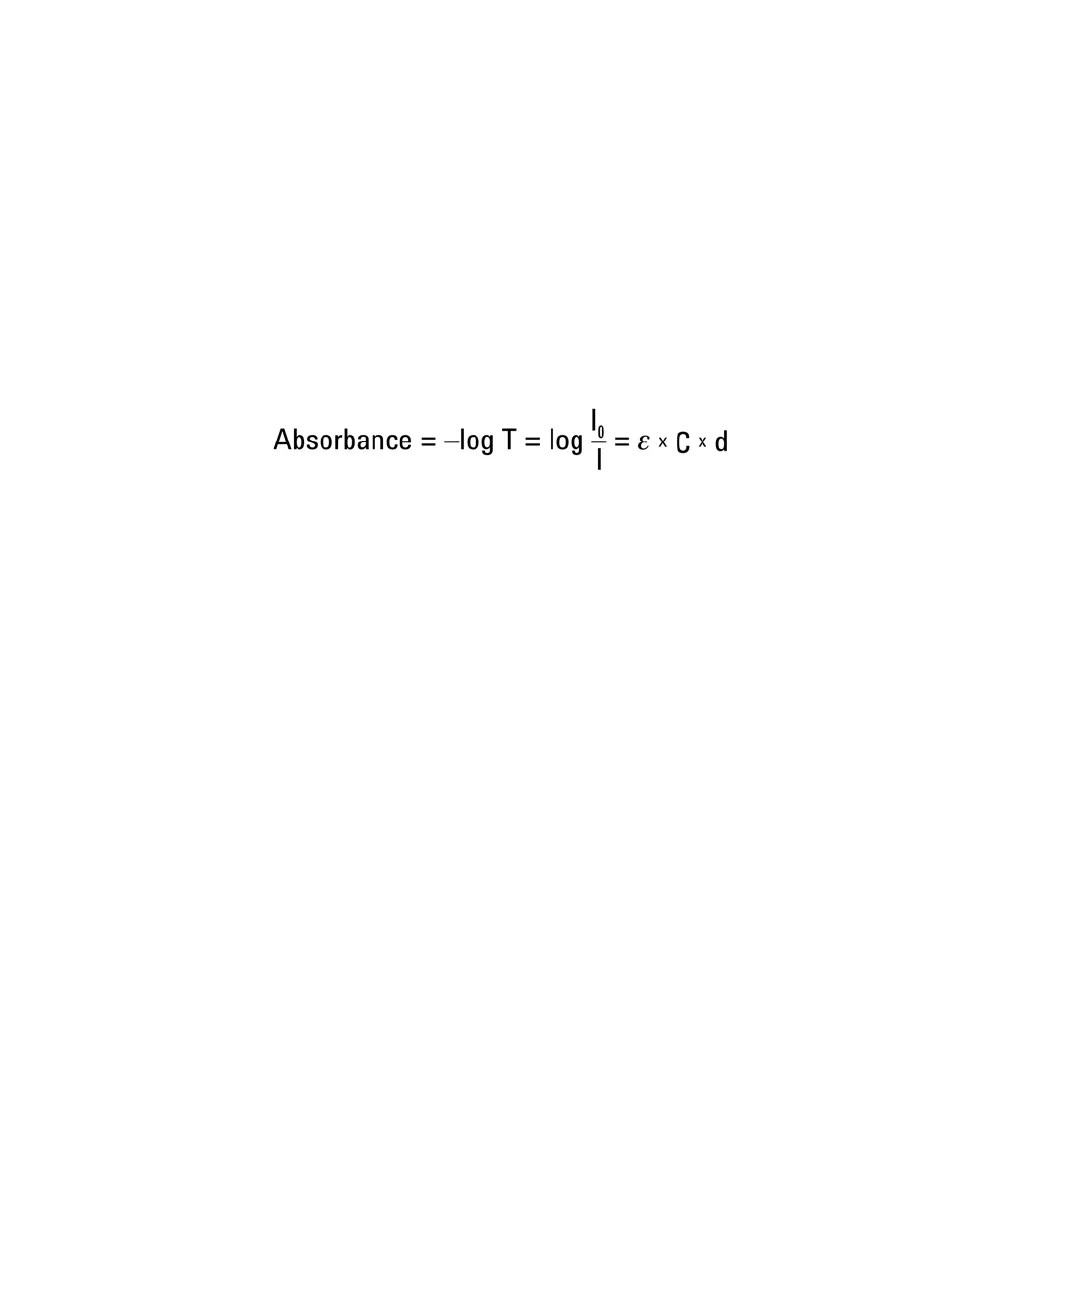
Lambert-Beer’s law shows a linear relationship between the flow cell path
length and absorbance.
where
T is the transmission, defined as the quotient of the intensity of the
transmitted light I divided by the intensity of the incident light, I
0
,
ε is the extinction coefficient, which is a characteristic of a given substance
under a precisely-defined set of conditions of wavelength, solvent,
temperature and other parameters,
C [mol/L] is the concentration of the absorbing species, and
d [cm] is the path length of the cell used for the measurement.
Therefore, flow cells with longer path lengths yield higher signals. Although
noise usually increases little with increasing path length, there is a gain in
signal-to-noise ratio. For example, in Figure 51 on page 120 the noise
increased by less than 10 % but a 70 % increase in signal intensity was
achieved by increasing the path length from 6 – 10 mm.
When increasing the path length, the cell volume usually increases — in our
example from 5 – 13 µL. Typically, this causes more peak dispersion. As
Figure 51 on page 120 demonstrates, this did not affect the resolution in the
gradient separation in our example.
As a rule-of-thumb the flow cell volume should be about 1/3 of the peak
volume at half height. To determine the volume of your peaks, take the peak
width as reported in the integration results multiply it by the flow rate and
divide it by 3).