Agilent 4155C/4156C User’s Guide Vol.1, Edition 11 5-17
Print/Plot Function
Printing/Plotting Measurement Data Graphs
Printing/Plotting Measurement Data Graphs
This section describes how to print/plot a graph of the measurement results on the
GRAPH/LIST: GRAPHICS screen.
Before beginning to print/plot, check the following:
• SYSTEM: MISCELLANEOUS screen
This screen specifies the 4155C/4156C control mode, GPIB address, output
equipment, and so on. Set all the entry fields properly. For more information, see
Setup Screen Reference manual.
• SYSTEM: PRINT/PLOT SETUP screen
This screen specifies the printer/plotter, information to print/plot, paper size, and
so on. Set all the entry fields properly. For more information, see Setup Screen
Reference manual.
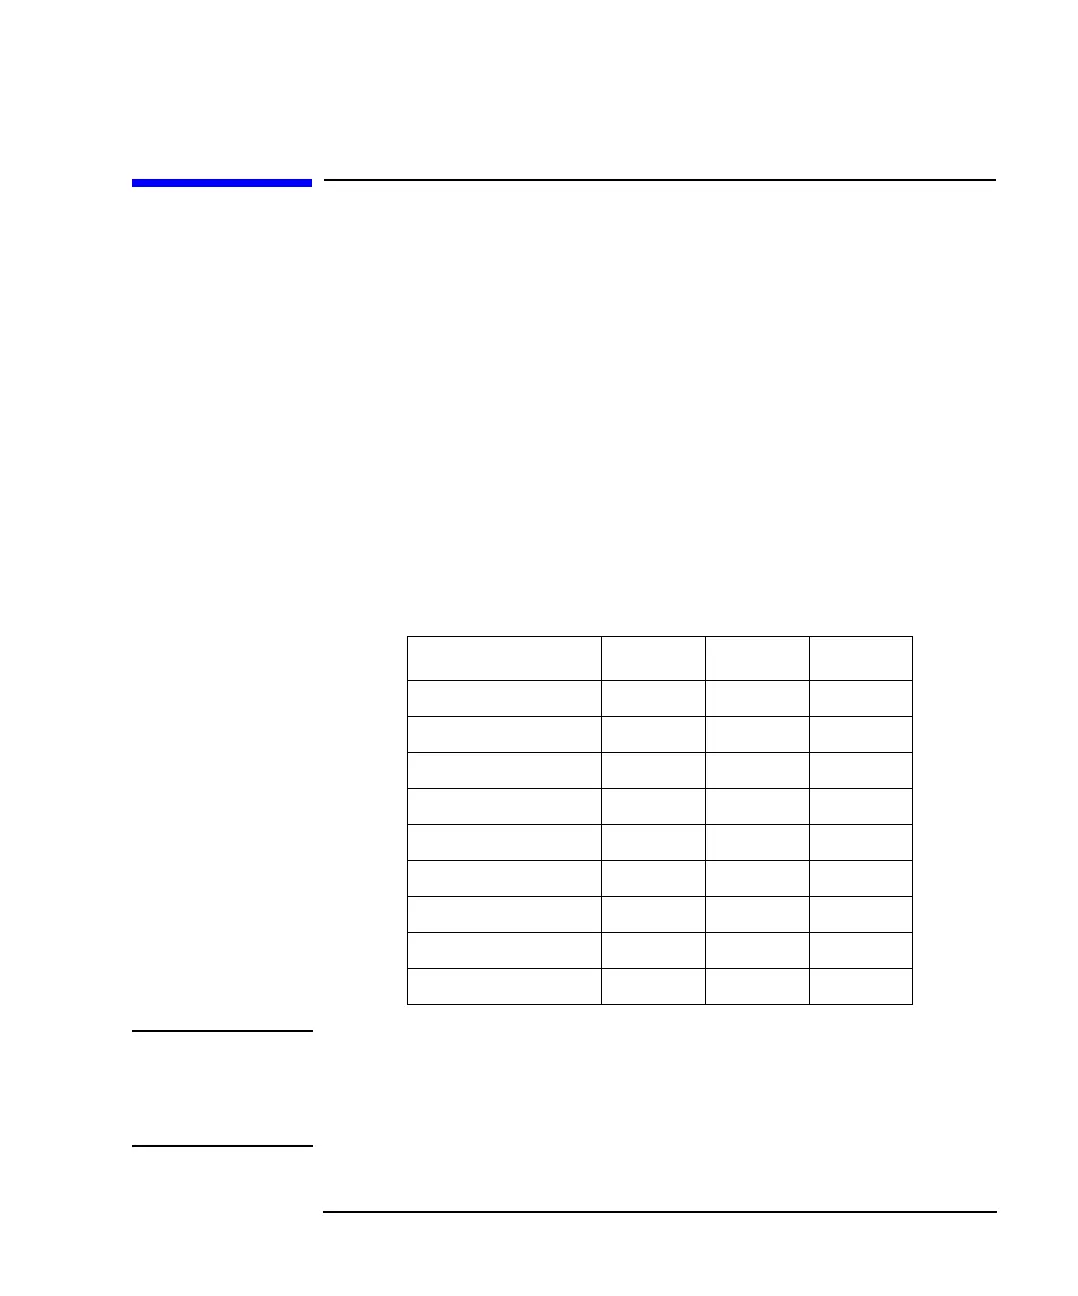
The following entry fields must be set:
NOTE Multiple Outputs
If you want to print two or more images on one sheet of paper, set the FORM FEED
entry field to DISABLE for all images, except the last image. Set ENABLE for the
last image.
Entry Field HP-GL PCL HR PCL
DESTINATION √√√
FORM FEED √√√
LINE √√√
COLUMN √√
COLOR/B/W √√√
PAPER √√√
OUTPUT ITEM √√√
INIT STRING √√√
TRAILER STRING √√√
 Loading...