76
HYPERION User Manual Bruker Optik GmbH
Operation 4
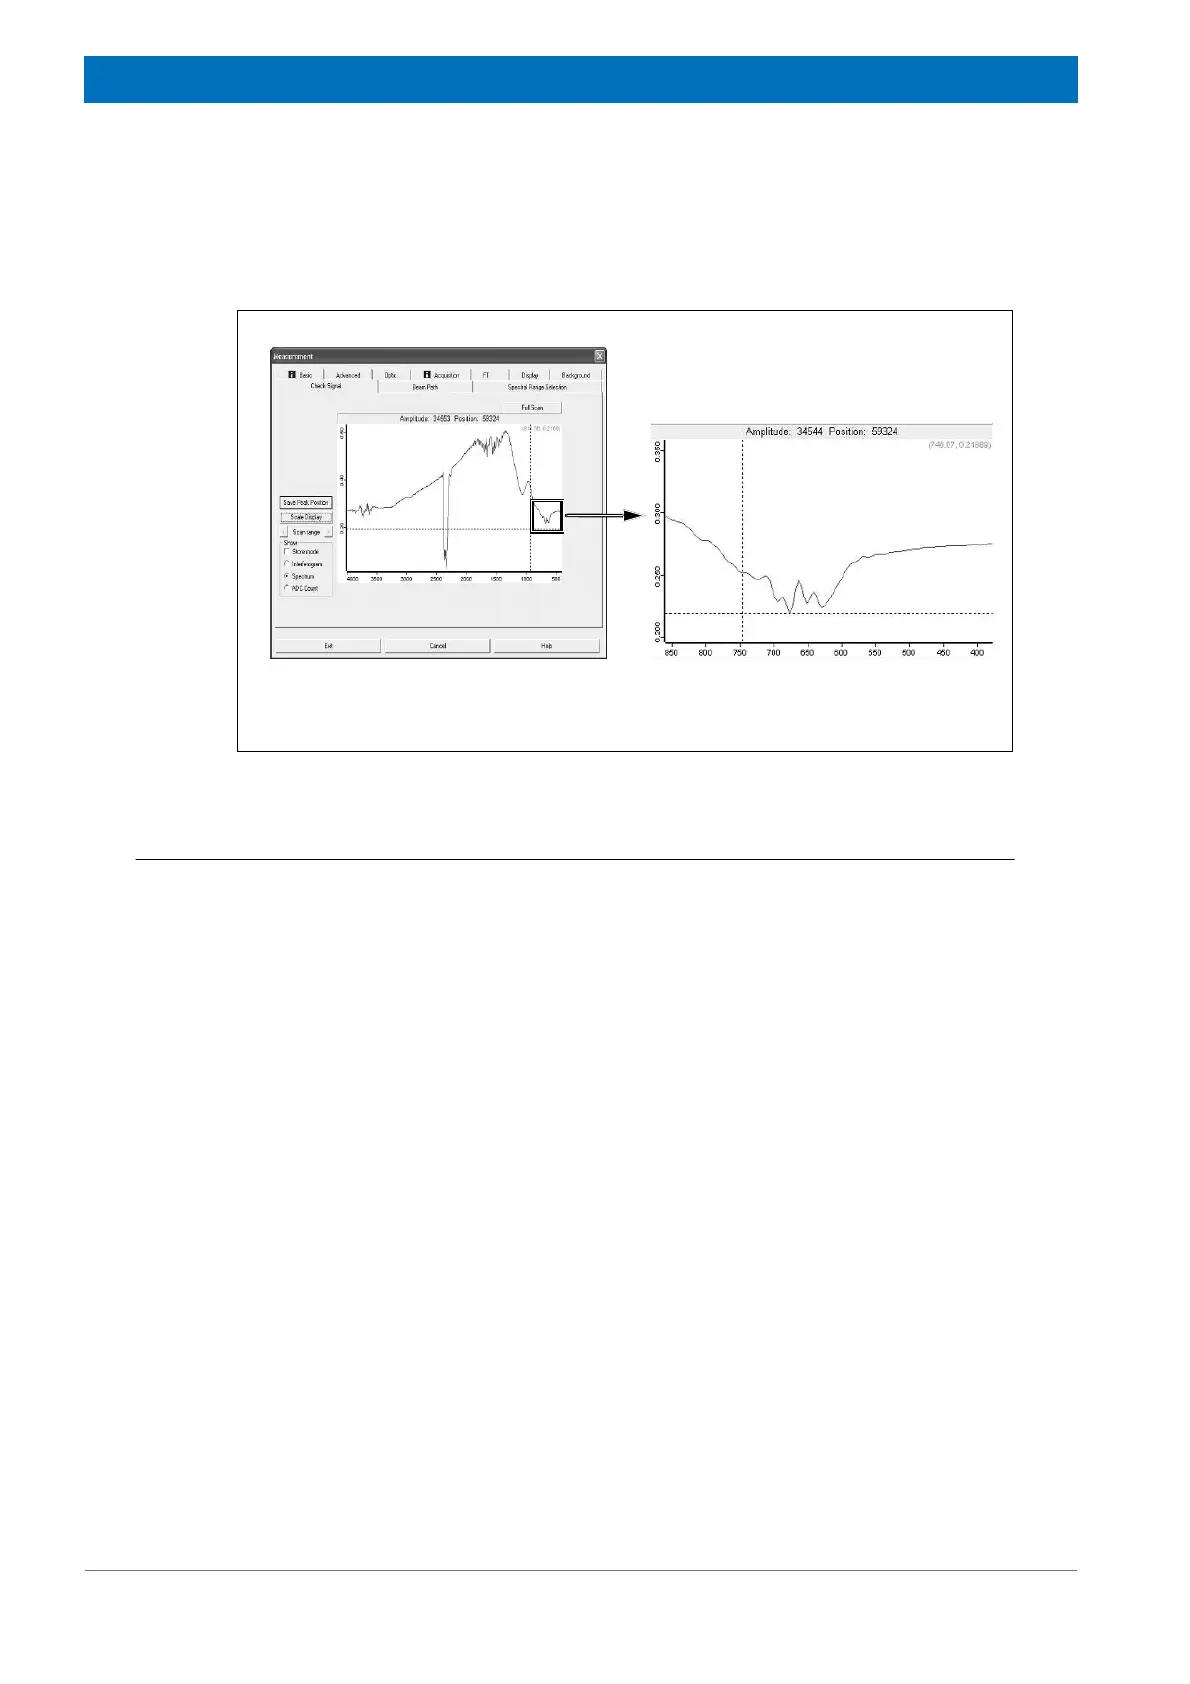
Figure 4.2 shows a spectrum acquired at a beginning oversaturation of the detector.
When the detector is totally oversaturated, the spectrum may have a completely different
appearance, for example a cosine curve or a zero line.
Reducing the IR signal intensity in case of a detector oversaturation
In case an oversaturated detector, you can:
• close the manual or motorized knife-edge aperture somewhat
• select in OPUS a smaller spectrometer aperture (max. 3 mm or smaller) (Note:
This solution variant involves the potential risk of forgetting to undo this aperture
setting afterwards again.)
• only in case of HYPERION 3000: insert a beam attenuator in the optical adapta-
tion box between microscope and spectrometer
Figure 4.2: Spectrum acquired at a beginning oversaturation of the detector
Enlarged section