Using the M4 TORNADO Software
M4 TORNADO
69
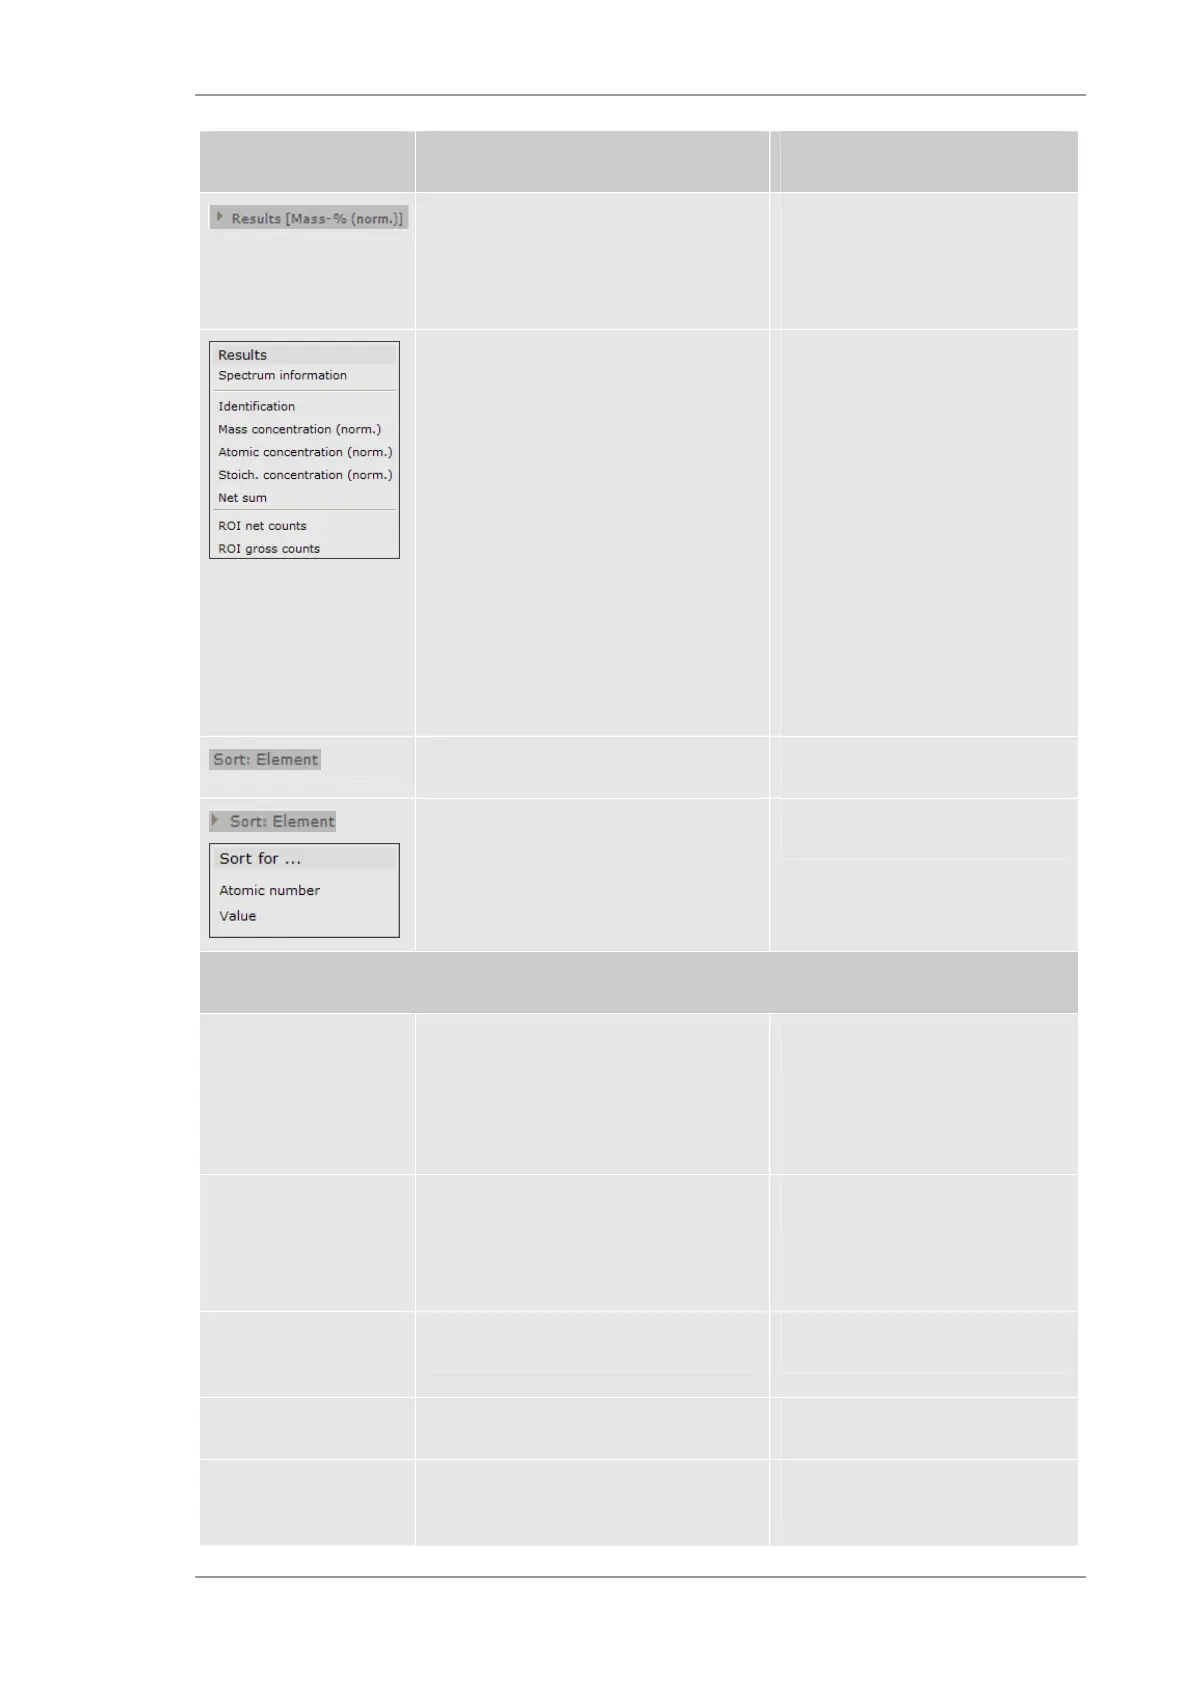
Object Description Hints
Selects the displayed value of
quantification
A pull-down menu opened by
clicking the right-facing arrow left
to Results shows various types
for data presentation.
The following information will be given:
Spectrum information: Measurement
conditions, counts, count rate
Identification: identified elements
Concentrations in different versions
Intensities in different versions
The displayed result data can be
saved with the function Result
table >> Save from the
Import/Export menu. They can be
saved in different formats (*.txt,
*.xls and several image formats).
Net sum: intensity as calculated
by quantification
ROI net sum: intensities
background subtracted
ROI sum: intensity summed up
including background
Lists the elements in alphabetical order
Definition of the sequence of displayed
results by atomic number or value
Hot keys
Alt + left mouse
button and move
cursor in spectrum
image or abscissa
scale to right or left
Moves a spectrum to the right or to the
left
Ctrl + left mouse
button and move
right or left in the
spectrum image
Broadens or narrows a spectrum
Shift + click or Ctrl +
click
Selects several spectra from the list
Ctrl + A
Highlights all spectra in the list
Del
Deletes the highlighted spectrum from
the list
 Loading...