4.5 Configurator Bar QUANTAX EDS
35
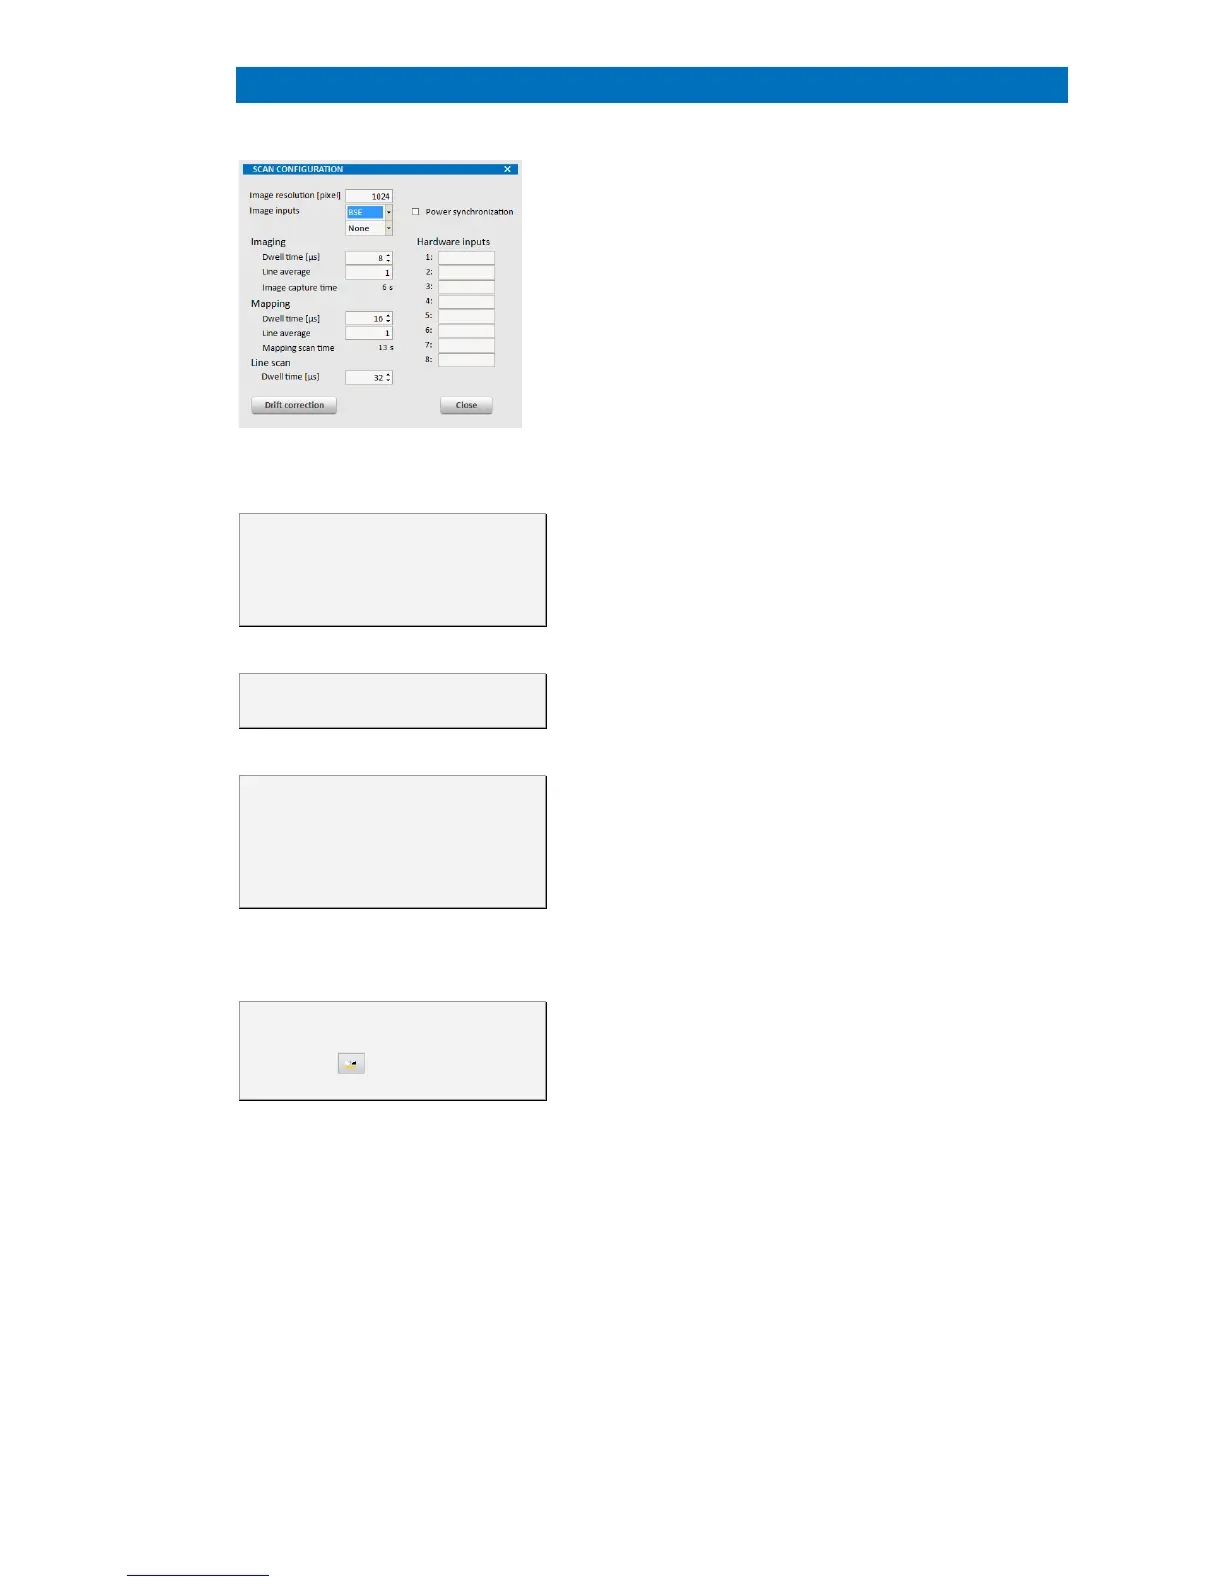
Fig. 4.5-12 Scan configuration dialog
The dwell time can only be set
in increments of numbers which are a
power of two. Direct input of arbitrary
numbers is not possible. Use the
arrows in the input field.
Very high image resolution will
slow down operation.
For Imaging, Mapping and
Line scan different timing settings are
maintained. However, the electron
image captured in the left image
window of each workspace always
follows the settings for Imaging.
The scan speed can also be
set from the dialog that opens after
clicking the icon next to the
image chart.
desired detector can be selected here. For each
channel only one image dete
ctor can be selected at a
If only Ch1 and Ch2 can be selected from the
ote that the image channel names
can be changed in the System workspace under
Microscope to e.g. SE, BSE, HAADF,… (
section 4.7.6).
Imaging. The Dwell time
is the time the electron
beam stays on a pixel while capturing an image.
Select expanded dwell times to allow filtering and
averaging of the image signal and obtain
factor controls the
number of times a horizontal line is scanned in the
slow scan direction and averaged before proceedi
to the next line. Increasing this factor
limiting the increased stress
on the sample by
maintaining a high scan speed. The line average
factor will multiply the total image acquisition time.
The total Image capture time is calculated and
displayed.
Mapping. The Dwell time
beam stays on a pixel while acquiring an EDS map.
factor for mapping controls the
number of times a horizontal line is scanned in the
slow scan direction and averaged before pro
to the next line. The capture time (Mapping
for one mapping frame is calculated by
multiplying the numbers of pixels and lines with the
dwell time and the line average factor. The real scan
time may be longer due to the time needed for d
processing by the computer.
Drift correction. When clicking on the
correction button, the IMAGE
It is described in detail in
section 5.5.
Power synchronization. When the accor
the scan process is
synchronized to the cycles of the AC mains voltage.
Power synchronization substantially reduces blurring
of vertical lines caused by electromagnetic
interference (at the expense of the scan speed). It is
applicable for capturing any image or map. However,
it is normally only useful in connection with very high
magnification of the microscope
r to be connected to the QUANTAX server is
provided.
Hardware inputs. The IO scan card provides
 Loading...