User Manual 5 Step-by-Step Guides
104
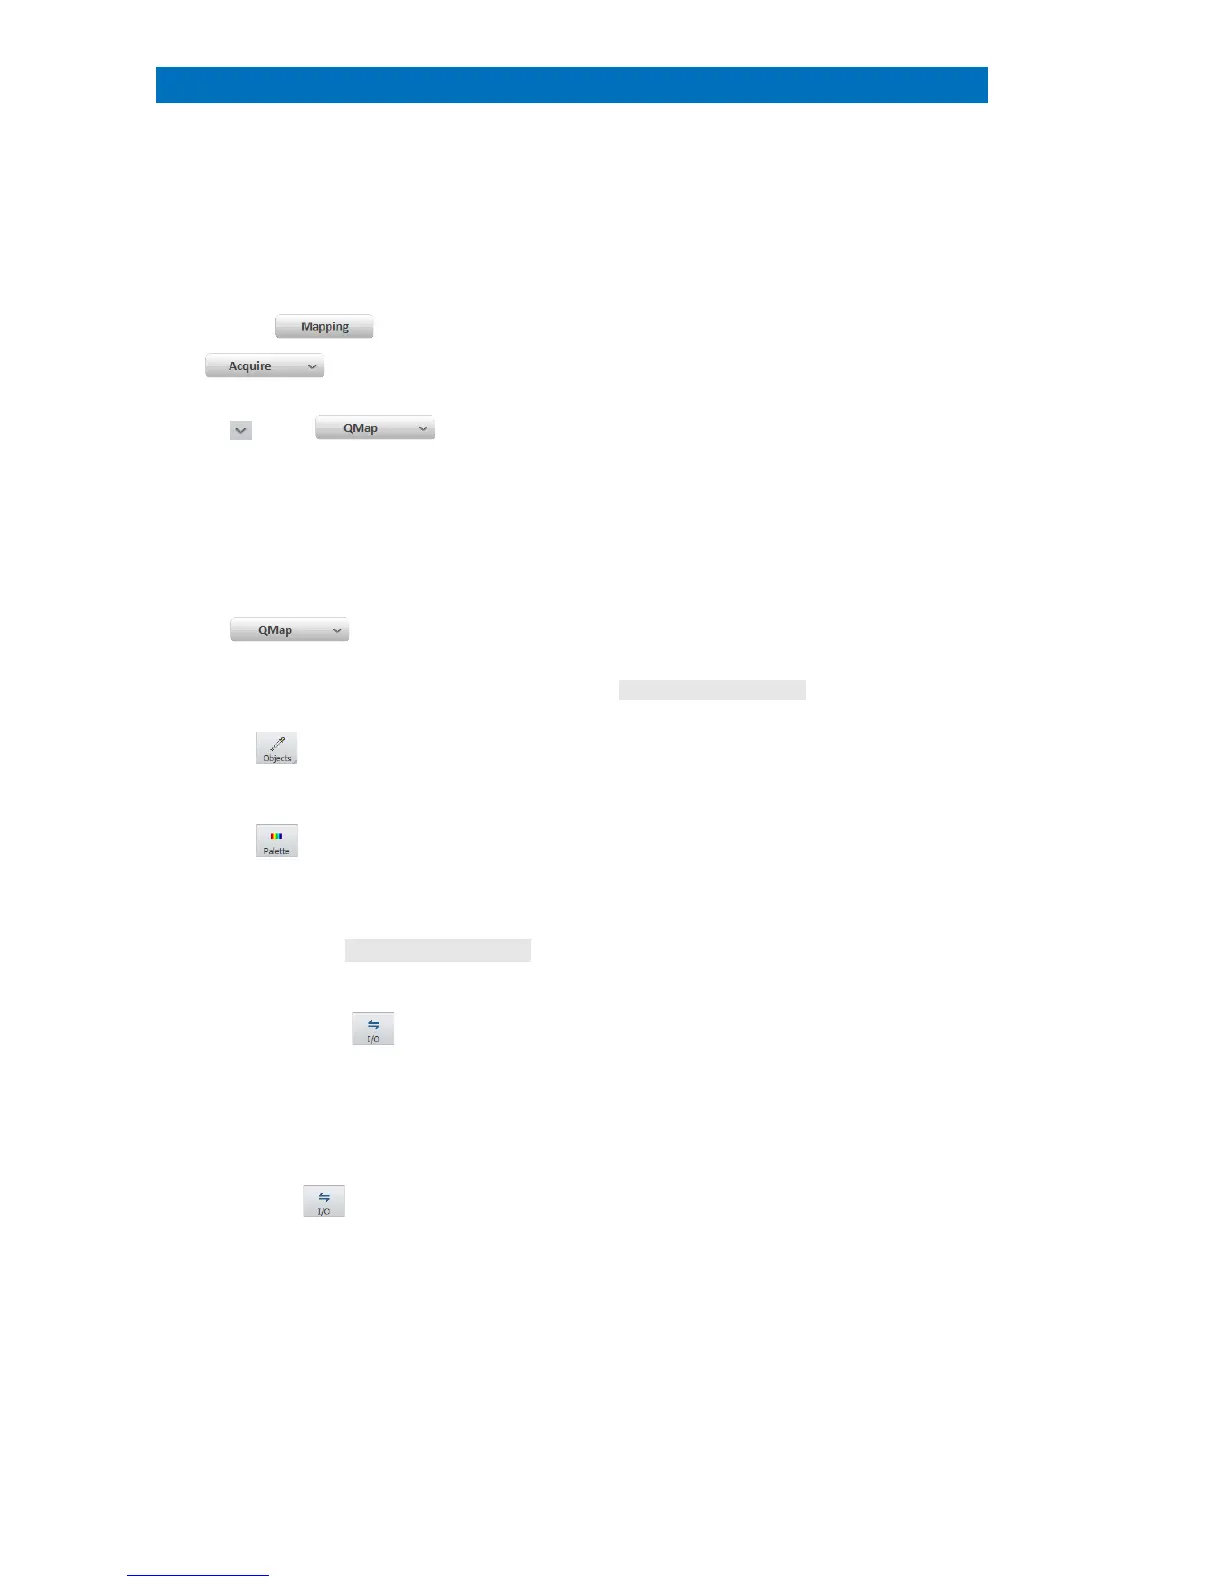
Quantitative Mapping (QMap)
This section describes the quantification of mappings.
Good spectrum statistics may improve the
quantification a
an appropriate quantification
Use a previously optimized method
(presetting element IDs, background fit
regions and quantification algorithm)
Use tile size of 3x3, 5x5 or 9x9 pixels to
reduce processing time and enhance count
statistics
. The Estimated time to complete
the QMap will be displayed.
quantification of the map.
QMap will terminate automatically after the
last p
ixel has been quantified.
Adjust colors and image controls.
See Map Display settings and refer to
section 5.19.
uantification results of regions of
Quantification results appear in the Map
result list.
to switch to pseudo colors
The pseudo colors display presents numerical
quantification values.
only for pseudo color display. If several
elements are selected, the map displays
summarized concentration values.
Set Result type in Map display settings
submenu
Select Net sum, Mass %, normalized Mass
% or Atomic %. Select
non-quantified intensity maps.
Use the workspace icon to
Save the quantified datacube (Hypermap) as
.bcf file.
Alternatively, drag and drop composite
element image to project or right click into
the map and use the local Mapping menu.
Use the chart icon in Map tab to
a) Save Map image (Element selection,
Settings, Result table)
button into the map image.
 Loading...