User Manual 5 Step-by-Step Guides
100
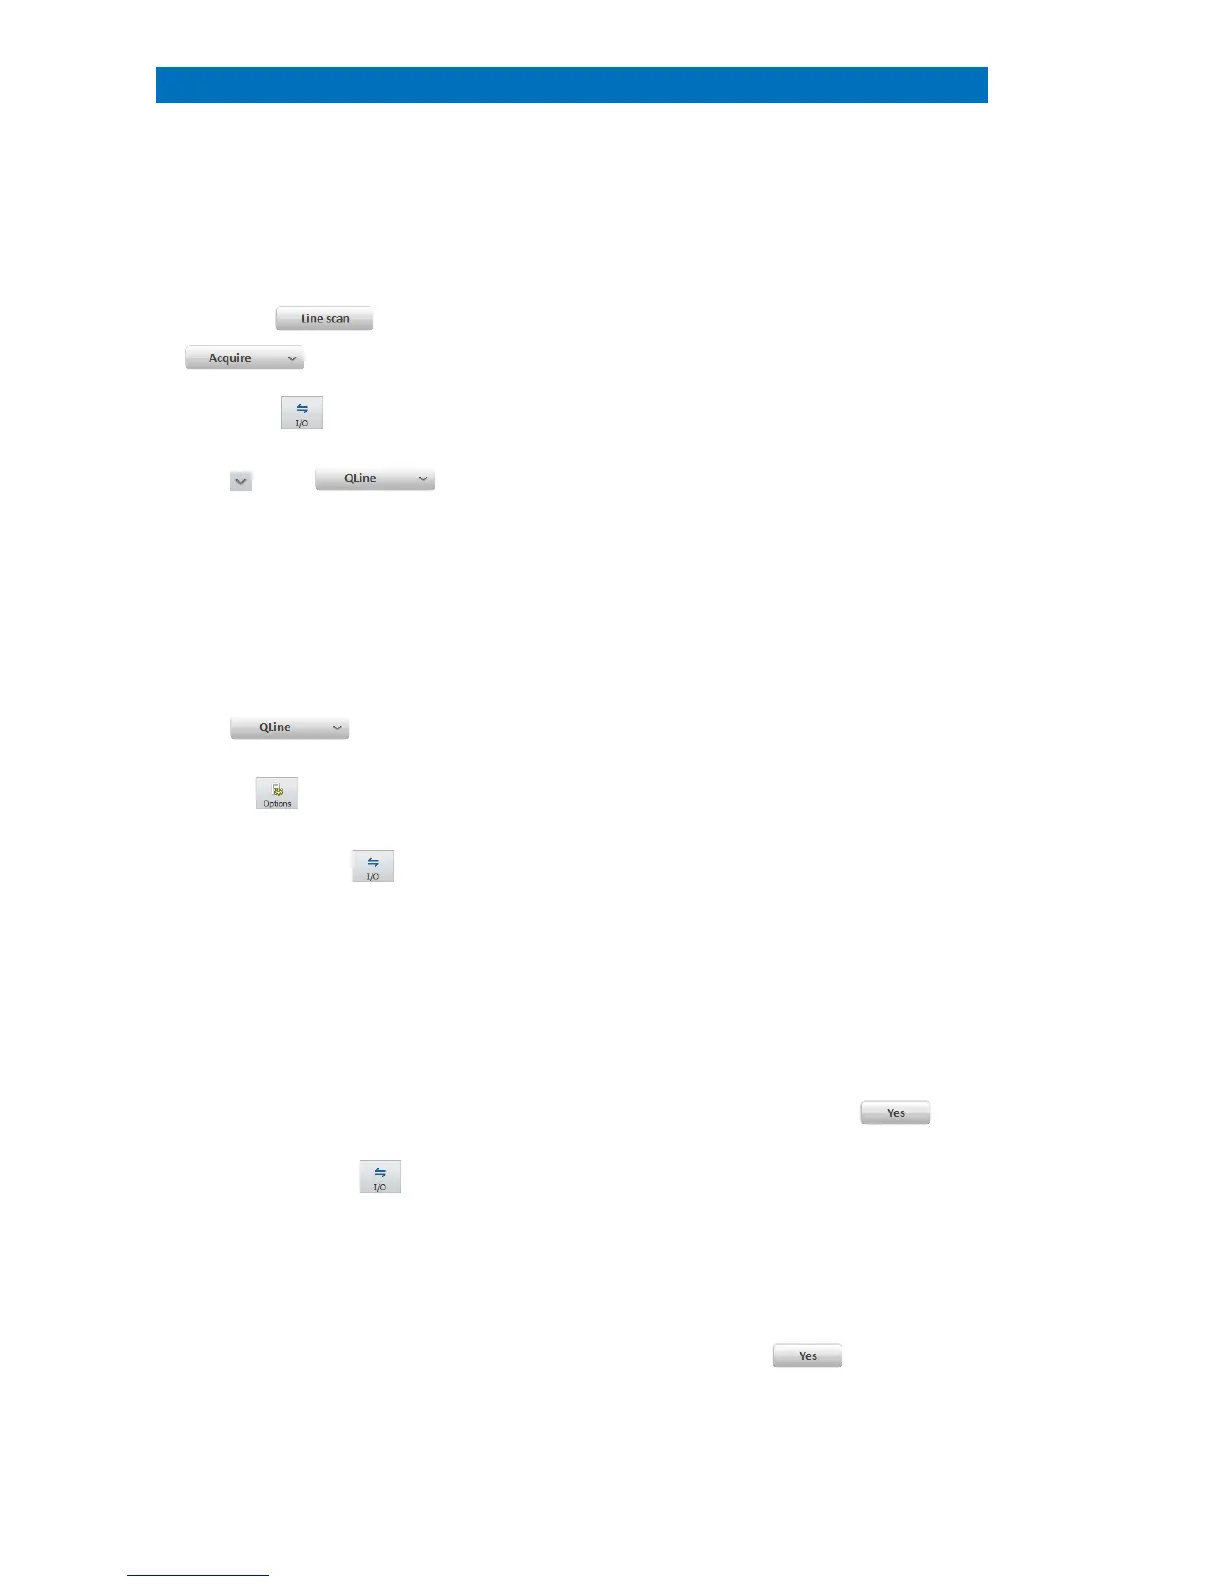
Quantitative Line Scan (QLine)
This section describes how to quantify a line scan.
oad a stored line scan file (.rtl) from the
retrieve it from the Project folder.
a) Load… an optimized quantification
method
Use the Scan spectrum of the Line scan to
optimize a quantification method. Save this
method to disk or add to project and drag and
drop from
the project into the Profiles tab.
5.12.1 for details. For electron
To enhance spectra statistics, use values 3, 5,
7, 9, 11, 13 to bin neighboring point spectra.
quantification of the line scan database.
icon in the Profiles tab to
change profile display options
Select from: Counts, Net sum, Mass
percent
, Mass percent (norm.) and Atomic
When adding the data into the project, or
saving the line scan
.rtl file format, the point
to the Project by confirming the pop-
window Do you want to save point
Use .rtl file format to save quantified line scan
data including scan image and point spectra.
Image(s), composite element profiles and
scan image will be transferred.
Do you want to
save point spe
to transfer spectral data.
Use the Profiles tab icon to
Save as .bmp, .jpg, .png, .tif file format
including
Composite element profile, Scan
Alternatively, right click into the profile and
use the local
Line scan menu. Confirm the
-up window Do you want to save point
 Loading...