User Manual 5 Step-by-Step Guides
90
Quantitative EDS of Electron Transparent Samples
5.13.1
Standardless Cliff-Lorimer Quantification
This guide describes the steps of standardless quantification of electron transparent samples.
Load or create a standards library
containing theoretical Cliff
The following workflow also applies to any
spectrum chart available in the ESPRIT
software
, e.g. also within in the Mapping
workspace to quantify complete maps.
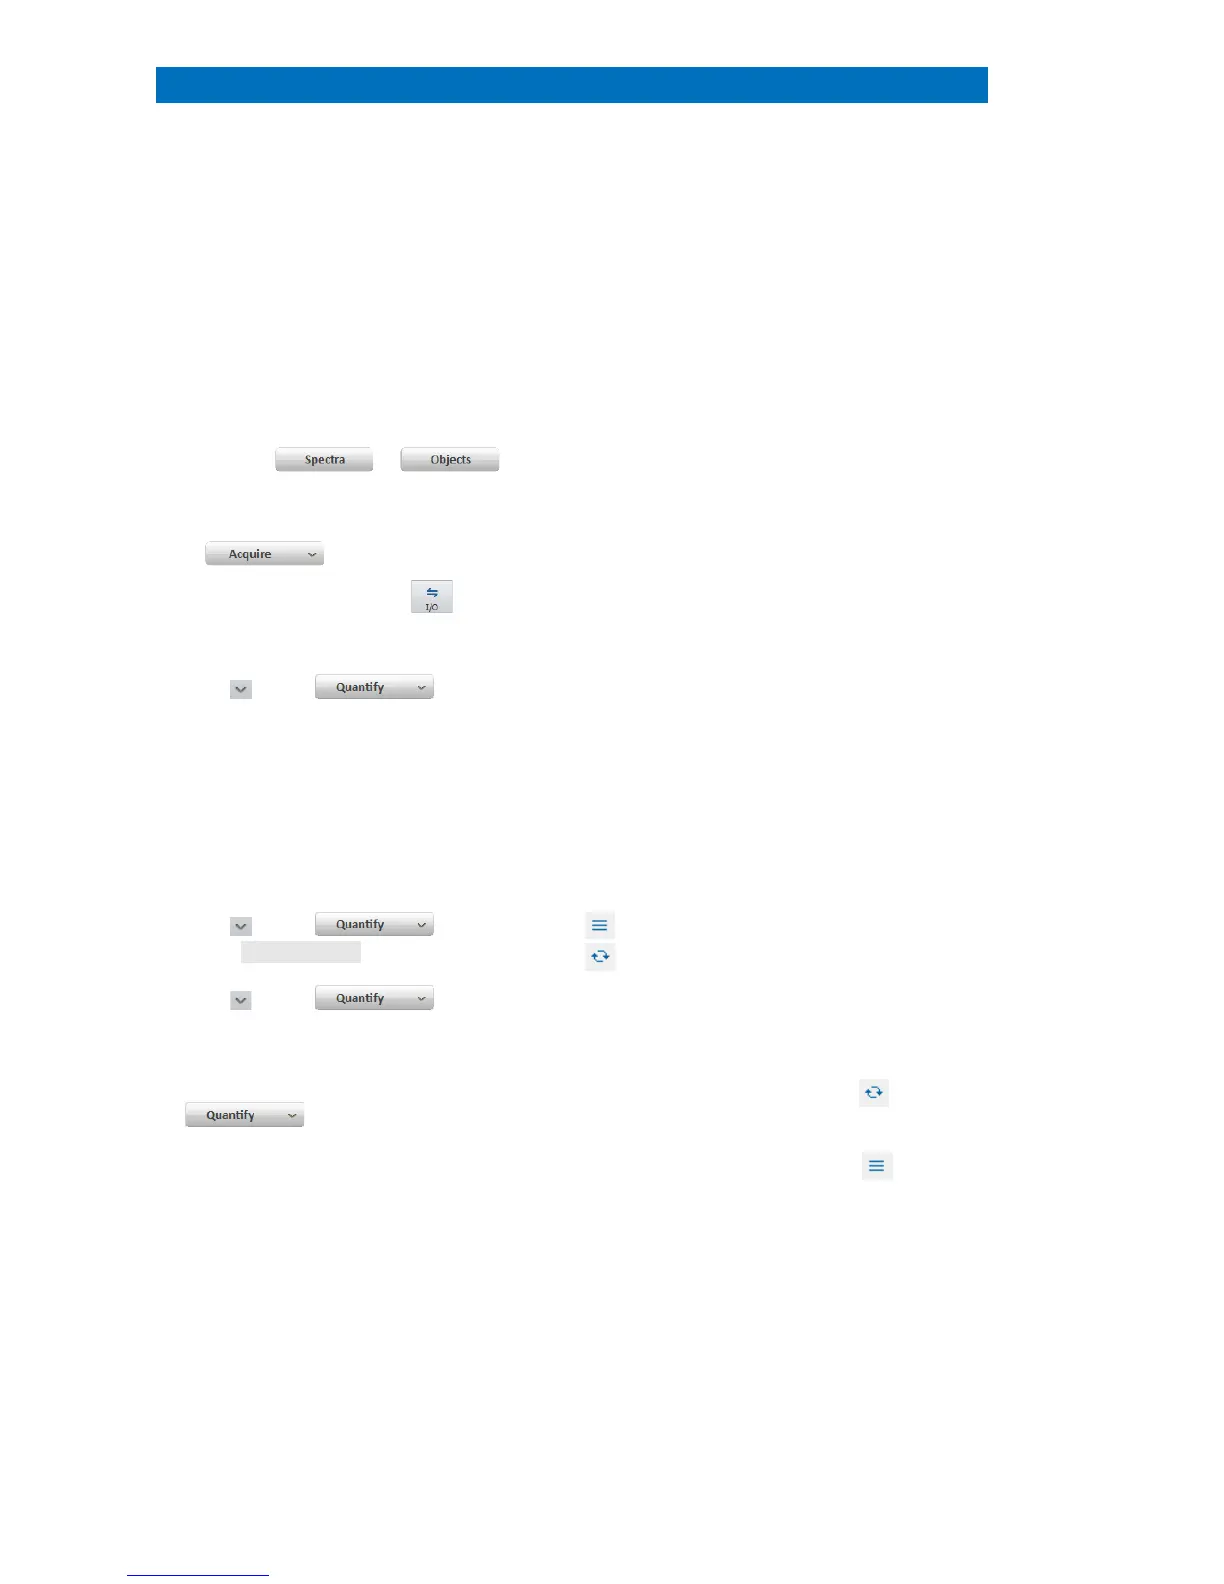
Use the Spectrum chart icon to
Optionally, drag and drop a spectrum from
the
Project into the spectrum chart. The
Load… to load a quantification
Select a TEM quantification method based on
Cliff
-Lorimer. Alternatively drag and drop a
quantification method from the project to the
spectrum chart.
Two different quantification
ods can be loaded, the active one is
Make sure that geometrical EDS
detector and HV parameters of spectrum
and Cliff
(standards library) match.
If the information message
s library” pops up, update the
s library as described in 5.11.2.
Use the method editor to set up or edit a
quantification method before
For details see section 5.12.1.
Start quantification by clicking the
If quantification is set to automatic ( ), the
quantification results appear in
If quantification is set to interactive (
Edit quantification parameters in the
quantification dialog
The left dialog part has the same functionality
as the method editor. All changes have an
immediate effect on the quantification results
displayed in the result table.
 Loading...