5.12 Quantitative EDS Analysis of Bulk Samples QUANTAX EDS
83
Standardless Quantification
This section describes the steps of automatic standardless quantification and quantification using
the quantification dialog.
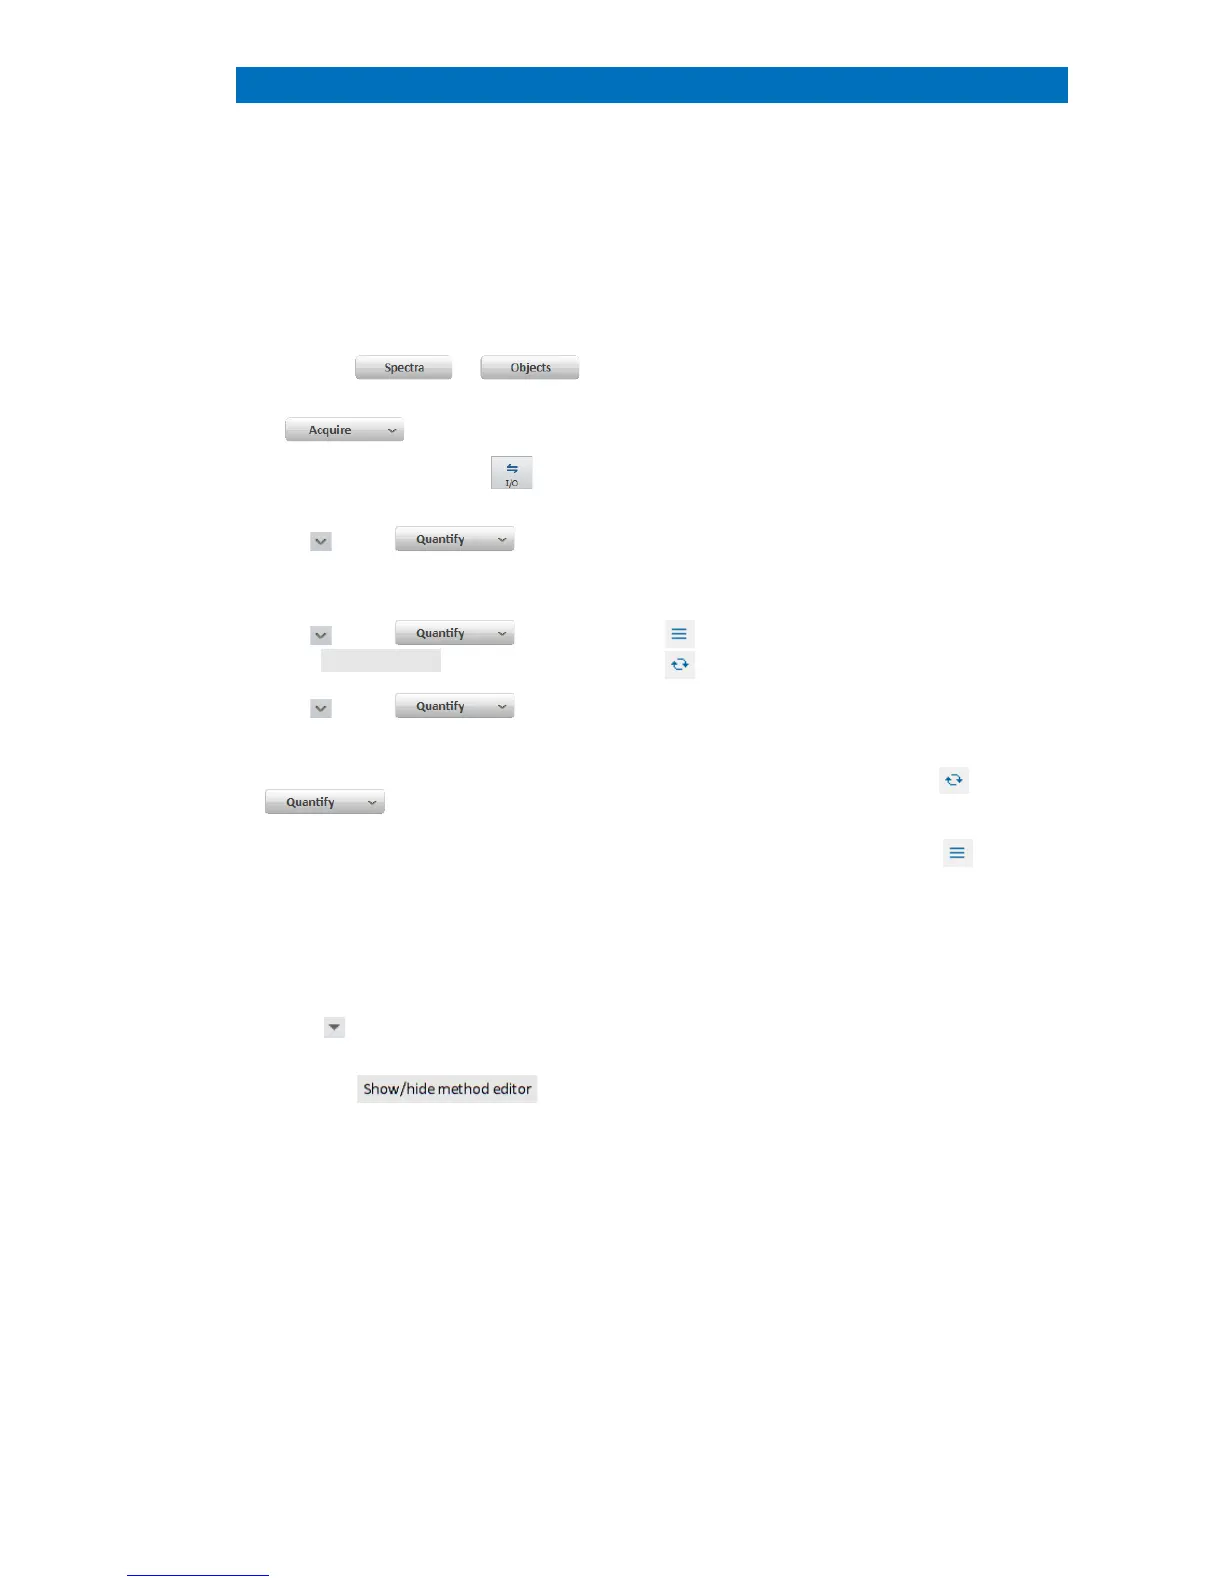
This workflow also applies to any spectrum
chart available in the E
Optionally, drag and drop a spectrum from
the
Project into the spectrum workspace
Load… to load a quantification
Select a quantification method (eg. Default,
Oxides, Standards or TEM)
drag and drop a quantification method from
the project to the spectrum chart.
Use the method editor to set up or edit a
quantification method before performing the
quantification. This step can be omitted.
Start quantification by clicking the
If quantification is set to automatic (
), the
quantification results appear in the spectrum
list
If quantification is set to interactive (
case proceed with step 6.
Edit quantification parameters using the
quantification
The left dialog part has the same functionality
as the method editor. All changes have an
immediate effect on the quantification results
displayed in the result table.
a) Use to drop down the different
settings menus
access/hide the settings of the
quantification method.
Use the Elements tab to identify
elements
Select an element by clicking on the ID in the
periodic table. Double
click on an
element to access the element properties
dialog. Use this dialog to set
or to change spectral line for
The Element finder displays elements
with s
pectral lines at the cursor position
Use right click and drag mouse to select a
spectral region: all elements are listed in the
Finder which have spectral lines in the
selected spectrum region.
 Loading...