User Manual 5 Step-by-Step Guides
84
displays non-
default settings for selected elements.
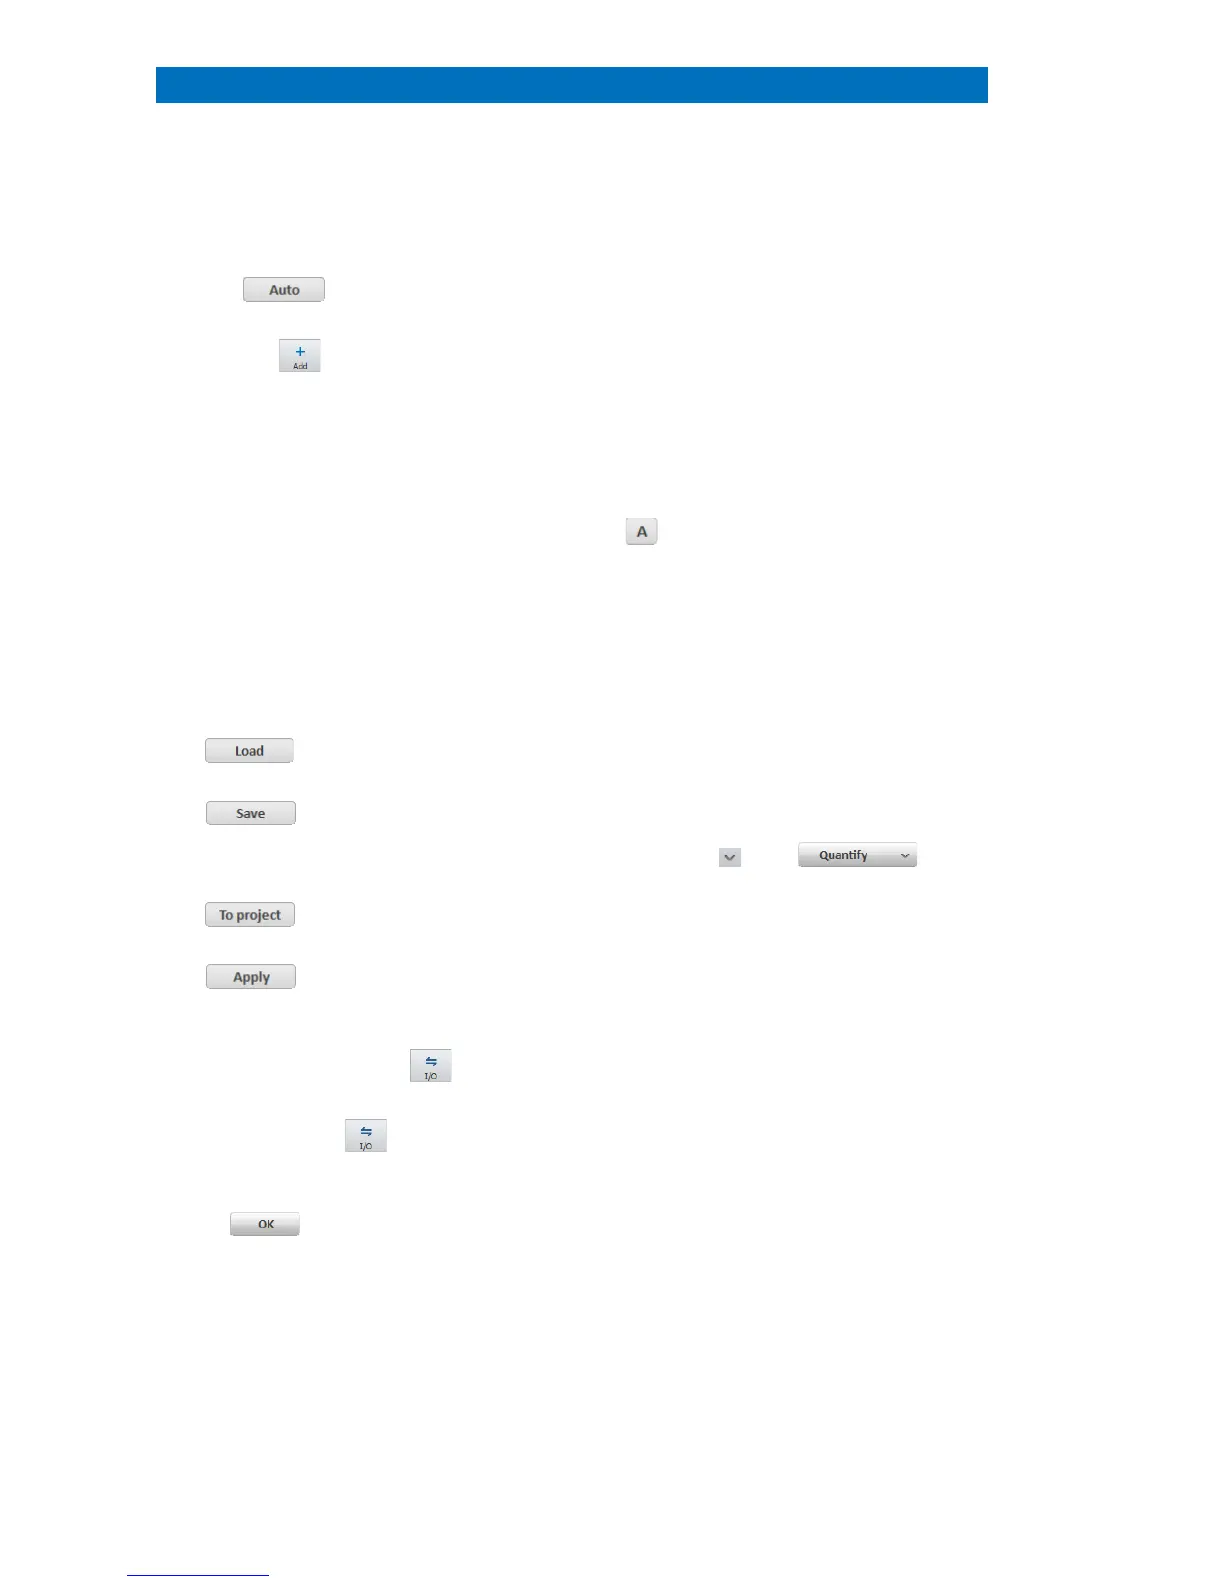
Use this list to change or review element
parameters.
Use Background settings to set
background fit areas and fit model
Activate and drag with right
mouse key in the spectrum diagram to
set a background fit area manually.
Deactivate Add button to use spectrum
diagram for Element finder
Select Deconvolution settings.
Use Series fit as default.
Select Quantification model.
Use PB/ZAF as default. Use Phi(Rho,Z) for
light elements.
Use Additional settings for
a) High voltage correction
Sample tilt angle correction
c) Selecting fast quantification.
to perform automatic high voltage
Compare deconvolution results with
measured spectrum.
Review quantification result table.
Use this to load a previously saved or a
default quan
tification (*.mtdx) file.
to save current settings as
Use this to save the current settings as
quantification
current settings to project
Use this to add current settings to project as
a quantification method file.
quantification method with
Use this to transfer current quantification
settings to method editor.
Use the Spectrum chart icon to
export or save spectrum diagram
Use this to export deconvolution results or
background
or Add to Project or Add to
The results will be displayed in the spectrum
list.
The display options of the spectrum
diagram are described in section 5.8.
 Loading...